Immunocytochemistry/Immunofluorescence: beta-Actin Antibody (AC-15) [NB600-501] - Analysis of beta-Actin antibody on mouse fibroblasts. Image from verified customer review.
Immunohistochemistry: beta-Actin Antibody (AC-15) [NB600-501] - Staining of formalin-fixed, paraffin-embedded human heart sections with 1:1000 Monoclonal Anti-beta-Actin Clone: AC-15.
Western Blot: beta-Actin Antibody (AC-15) [NB600-501] - Analysis of beta-Actin in bovine whole skeletal muscle lysate. Image from verified customer review.
Western Blot: beta-Actin Antibody (AC-15) [NB600-501] - Whole cell extract of human fibroblasts was separated on SDS-PAGE and blotted with Monoclonal Anti-beta-Actin. The antibody was developed with Goat Anti-Mouse IgG, Peroxidase conjugate and AEC substrate. Lanes A: Antibody dilution 1:5,000 B: Negative control (only secondary antibody).
Western Blot: beta-Actin Antibody (AC-15) [NB600-501] - beta-Actin expression in human glioma cells using anti-beta-Actin antibody. Image from verified customer review.
Western Blot: beta-Actin Antibody (AC-15) [NB600-501] - HEK293T cells transfected with Niaph virus Matrix Protein, expression 24h later. This image was submitted via customer review.
Western Blot: beta-Actin Antibody (AC-15) [NB600-501] - MMP-11 expression in oral cancer cell lines and the MMP-11 knockdown in SCC9 cells reduce cell migration. Western blot analysis showing the expression of MMP-11 protein in five oral cancer cell lines. Beta-Actin is included as a loading control. Image collected and cropped by CiteAb from the following publication (https://dx.plos.org/10.1371/journal.pone.0113129), licensed under a CC-BY license.
Western Blot: beta-Actin Antibody (AC-15) [NB600-501] - HSP90 and HSP70 interact with PABPN1. Interaction of PABPN1 with HSP90. Lysates from HEK293 cells transfected with Flag-HSP90 and GFP-tagged A17-PABPN1 were immunoprecipitated with an anti-Flag antibody. Immunoprecipitates (IP) were analyzed by Western blot (IB).Beta-Actin is included as a loading control. Image collected and cropped by CiteAb from the following publication (https://dx.plos.org/10.1371/journal.pone.0138936), licensed under a CC-BY license.
Western Blot: beta-Actin Antibody (AC-15) [NB600-501] - GFAP and IL-6 are elevated in cultures of spinal cord compared to cortical astrocytes. ((G, H) Analysis of protein homogenates from brain or spinal cord astrocyte cultures also demonstrated higher levels of GFAP expression, but no differences in ALDH1L1. Beta-Actin is included as a loading control. Image collected and cropped by CiteAb from the following publication (https://dx.plos.org/10.1371/journal.pone.0180697), licensed under a CC-BY license.
Immunocytochemistry/Immunofluorescence: beta-Actin Antibody (AC-15) [NB600-501] - Cultured FS-11 human fibroblast cell line stained using Monoclonal Anti-Beta-Actin, Clone No. AC-15 (NB600-501).
Immunocytochemistry/Immunofluorescence: beta-Actin Antibody (AC-15) [NB600-501] - HS-68 cells.
Simple Western: beta-Actin Antibody (AC-15) [NB600-501] - Analysis using the HRP conjugate of NB600-501. Electropherogram image(s) of corresponding Simple Western lane view. Beta-Actin antibody was used at 1:500 dilution on Hela, MCF-7, SH-SY5Y, & Jurkat lysate(s).
Simple Western: beta-Actin Antibody (AC-15) [NB600-501] - Analysis using the HRP conjugate of NB600-501. Image shows a specific band for Beta-Actin in 0.2 mg/mL of Hela, MCF-7, SH-SY5Y, & Jurkat lysate(s). This experiment was performed under reducing conditions using the 12-230 kDa separation system. * Non-specific interaction with the 230 kDa Simple Western standard may be seen with this antibody.
Western Blot: beta-Actin Antibody (AC-15) [NB600-501] -
Activation of the mTOR signaling pathway during spheroid formation on chitosan film. (b and c) Whole-cell lysates were analyzed by western blotting with specific antibodies against indicated molecules. beta-tubulin and actin were used as the loading control. Image collected and cropped by CiteAb from the following publication (https://www.nature.com/articles/s41598-017-10708-0), licensed under a CC-BY licence.
Western Blot: beta-Actin Antibody (AC-15) [NB600-501] -
alphav regulates TLR signalling by engagement of autophagy machinery. (g,h) Western blot analysis of phosphorylated IKKalpha in cytoplasmic fractions (g), and NF-kappaB and IRF7 in nuclear fractions (h) from sorted MZ B cells isolated from alphav-CD19 and control mice, stimulated with CpG DNA for the indicated time (mins). Also shown are staining of actin (g) or LSD1 (h) to confirm equivalent protein loading. In both cases, representative blots from at least three independent experiments are shown. Image collected and cropped by CiteAb from the following publication (https://www.nature.com/articles/ncomms10917), licensed under a CC-BY licence.
Western Blot: beta-Actin Antibody (AC-15) [NB600-501] -
Wnt effect on AChR clustering requires interaction with MuSK. D) Wnt9a and Wnt11 induce MuSK tyrosine phosphorylation. C2C12 myotubes were treated by agrin or Wnts for 1 h. MuSK was purified by immunoprecipitation and probed with the 4G10 antibody. E, Wnt9a and Wnt11 induce MuSK dimerization. Flag-MuSK and MuSK-Myc were transfected into C2C12 myoblasts and resulting myotubes were treated by Wnts, agrin or control media for 1 h. Flag-MuSK was precipitated by Flag antibody and associated MuSK-Myc was determined by anti-Myc antibody. Band intensity of immunoblot was analyzed by ImageJ software. *, p < 0.01, one-way ANOVA with Student's t test. Image collected and cropped by CiteAb from the following publication (https://pubmed.ncbi.nlm.nih.gov/22309736), licensed under a CC-BY licence.
Western Blot: beta-Actin Antibody (AC-15) [NB600-501] -
Triple AAV Vectors Drive Full-Length Protein Expression in the Pig Retina. (A) Western blot (WB) analysis of lysates from Large White pig retina 2 months following subretinal injection of either single or triple AAV2/8 vectors encoding for ED under the control of the PR-specific promoter IRBP. The arrow indicates the full-length protein. Image collected and cropped by CiteAb from the following publication (https://pubmed.ncbi.nlm.nih.gov/29292161), licensed under a CC-BY licence.
Western Blot: beta-Actin Antibody (AC-15) [NB600-501] -
Dexamethasone reduces VEGF, TNF, and EPCR, protecting mouse lungs and PMLECs from increased vascular permeability. (l) VEGF levels were measured in these groups. Infected+Dexa: P. berghei ANKA-infected and dexamethasone-treated mice. Graphs: (a, c, d, g, and h) the Mann-Whitney test is representative of (a, d, g, and h) two independent and (c) two grouped experiments; (b, e, and k) the unpaired t-test is from (b) two grouped, (e) two independent, and (k) three grouped experiments; (i) the Kruskal-Wallis test is from three grouped experiments; (l) the one-way ANOVA is representative of two independent experiments. Bars represent the average +/- SD (*p < 0.05; **p < 0.01; ****p < 0.0001). Red dashed lines: noninfected mice. Image collected and cropped by CiteAb from the following publication (https://pubmed.ncbi.nlm.nih.gov/31871954), licensed under a CC-BY licence.
Western Blot: beta-Actin Antibody (AC-15) [NB600-501] -
Lon expression is induced by a variety of stressors. E). D-54 cells were treated with 100uM or 200uM of CoCl2 for 24 hours. Western blot was used to detect HIF-1alpha, LONP1 and COX IV. Actin was used as the internal control. Image collected and cropped by CiteAb from the following publication (https://pubmed.ncbi.nlm.nih.gov/27764809), licensed under a CC-BY licence.
Western Blot: beta-Actin Antibody (AC-15) [NB600-501] -
Celecoxib induced cell cycle arrest at the G2 phase in CGCCA cells.CGCCA cells were treated with the indicated concentration of celecoxib for 1 day, and the cell cycle distribution was analysed. (E) Expression levels of Cdc25C and CDK1 in CGCCA cells after 1 day of treatment with the indicated concentrations of celecoxib as measured using western blot. Results are presented as % of the control. Each value is a mean +/- SD of 3 to 5 determinations. *p<0.05, **p<0.001 (versus control). Image collected and cropped by CiteAb from the following publication (https://dx.plos.org/10.1371/journal.pone.0069928), licensed under a CC-BY licence.
Western Blot: beta-Actin Antibody (AC-15) [NB600-501] -
The expression of HO-1 is higher in ALI/ARDS-developing mice compared to HP-developing mice. (b) Immunoblot of HO-1 and beta actin control (left). Protein levels of HO-1 measured by immunoblot densitometry (right). Values are expressed in HO-1 band densities adjusted by the beta actin control. Image collected and cropped by CiteAb from the following publication (https://pubmed.ncbi.nlm.nih.gov/27974865), licensed under a CC-BY licence.
Western Blot: beta-Actin Antibody (AC-15) [NB600-501] -
16:4(n-3) stimulation increases cPLA2 activity in splenic macrophages. D) In addition, splenic macrophage cell lysates were analyzed by Western blot for phospho-cPLA2. Actin was used as a loading control. Image collected and cropped by CiteAb from the following publication (https://pubmed.ncbi.nlm.nih.gov/28183801), licensed under a CC-BY licence.
Western Blot: beta-Actin Antibody (AC-15) [NB600-501] -
Polyphyllin I triggers PINK1/PARK2-dependent mitophagyA. MDA-MB-231 cells were treated with 8 μM PPI for different periods of time as indicated, and PARK2, P62, and ubiquitin (UB) levels in mitochondrial fractions were determined by western blot. B. Cells were cotransfected with GFP-UB and RFP-mito and treated with 8 μM PPI for 9 h, after which PARK2 (Alexa Fluor 405, pink) and P62 (Alexa Fluor 647, blue) immunostaining was detected using confocal microscopy. C. Cells cotransfected with GFP-UB and RFP-LC3 were treated with 8 μM PPI for 9 h, after which PARK2 (Alexa Fluor 405, pink) and TOMM20 (Alexa Fluor 647, blue) immunostaining was detected using confocal microscopy. Scale bars: 10 μm. D-E. MDA-MB-231 cells were treated with 8 μM PPI for different periods of time as indicated; whole-cell lysates were then separated on 8% SDS-PAGE gels and analyzed by western blot using the anti-PINK1 antibody. Relative full-length (∼63 kDa) and cleaved (∼52 kDa) PINK1 levels were quantified by densitometry and normalized to Tubulin. The results were expressed as a percentage of control, which was set at 100%. Data are presented as mean ± SD (*P< 0.01 vs. the control). F. Cells were treated with 8 μM PPI for different periods of time as indicated, and whole-cell lysates were then subjected to western blot analysis. G. Cells were treated with 8 μM PPI for 9 h, after which mitochondrial fractions were prepared and subjected to immunoprecipitation using anti-PINK1 antibody; associated PARK2 was detected using immunoblotting. H. RFP-mito-expressing MDA-MB-231 cells were treated with 8 μM PPI for 9 h, and PINK1 (Alexa Fluor 488, green) and PARK2 (Alexa Fluor 405, pink) immunostaining were evaluated using confocal microscopy. Scale bars: 10 μm. Image collected and cropped by CiteAb from the following open publication (https://www.oncotarget.com/lookup/doi/10.18632/oncotarget.14413), licensed under a CC-BY license. Not internally tested by Novus Biologicals.
Western Blot: beta-Actin Antibody (AC-15) [NB600-501] -
Vemurafenib treatment inhibits the phosphorylation of CSE1L and ERK1/2. a Vemurafenib treatment inhibited the phosphorylation of ERK1/2 and CSE1L. The levels of hyper-phosphorylated CSE1L, hypo-phosphorylated CSE1L, and phospho-ERK1/2 in A375 melanoma cells treated with or without 1 μM vemurafenib for 24 h were subjected to immunoblotting with anti-CSE1L (clone 3D8), anti-phospho-CSE1L, and anti-phospho-ERK1/2 antibodies. beta-actin levels were assayed as a control. b A representative image shows vemurafenib-induced apoptotic body formation in A375 melanoma cells. Cells were treated with or without 1 μM vemurafenib for 72 h. c DNA fragmentation induced by vemurafenib in A375 melanoma cells treated with or without 1 μM vemurafenib for 72 h. Each immunoblot was repeated at least three times and showed similar results. The data shown here are the representative immunoblots. Image collected and cropped by CiteAb from the following open publication (https://www.translational-medicine.com/content/13/1/191), licensed under a CC-BY license. Not internally tested by Novus Biologicals.
Western Blot: beta-Actin Antibody (AC-15) [NB600-501] -
Effect of PRDX2 and PRDX4 on HIF-1 alpha-p300 interactionHeLa cells were transfected with empty vector (EV) or vector encoding PRDX2-V5 or PRDX4-V5, and exposed to 1% O2 for 24 h. WCL was subject to IP with anti-p300 antibody, followed by immunoblot assays using antibodies against HIF-1 alpha, V5, and p300. Image collected and cropped by CiteAb from the following open publication (https://www.oncotarget.com/lookup/doi/10.18632/oncotarget.7142), licensed under a CC-BY license. Not internally tested by Novus Biologicals.
Western Blot: beta-Actin Antibody (AC-15) [NB600-501] -
TRIB3 supports MYC stability by disturbing UBE3B-mediated MYC ubiquitination.a Heatmap presenting TRIB3 expression in 11 blood cancer cell lines and 1 primary human lymphoma cell line (T144) with or without TRIB3 depletion. b Effect of TRIB3 overexpression on MYC degradation in vivo. Raji cells were infected with TRIB3- or GFP- adenovirus, and 12 h later, incubated with cycloheximide (CHX; 10 μg/mL) for the indicated times. The data are presented as the means ± S.E.M from three independent experiments. c Effect of TRIB3 deletion on MYC degradation in vivo. Control or TRIB3-deleted Raji cells were incubated with CHX (10 μg/mL) or CHX plus MG132 (5 μm) for the indicated times. The MYC protein was detected by western blot; GAPDH was used as a loading control. The data are presented as the means ± S.E.M from three independent experiments. d Effect of TRIB3 overexpression on MYC ubiquitination in vivo. HEK 293T cells were transfected with the indicated plasmids for 24 h. Extracts of cells were IP with an anti-HA Ab. Ubiquitinated MYC was detected by immunoblotting. The data are presented as presentative from three independent experiments. e Strategy for screening the potential E3 ligases of MYC. f The interaction of UBE3B and MYC was evaluated by Co-IP assays. Raji cell extracts were IP with rabbit immunoglobulin G (IgG) or an anti-MYC Ab and blotted with an anti-UBE3B Ab. The data are presented as presentative from three independent experiments. g Colocalization of MYC and UBE3B was detected in primary human DLBCL cells (T69) by the Duolink PLA assay. Scale bar, 2 μm. The data are presented as presentative from three independent experiments. h Effect of TRIB3 on MYC degradation mediated by UBE3B. HEK 293T cells were transfected with the indicated plasmids, and 12 h later, incubated with CHX (10 μg/mL) for the indicated times. The data are presented as presentative and the means ± S.E.M from three independent experiments. i Effect of TRIB3 on MYC ubiquitination induced by UBE3B in vivo. HEK 293T cells were transfected with the indicated plasmids for 24 h. Cell extracts were IP with an anti-Flag Ab. Ubiquitinated MYC was detected by immunoblotting. The data are presented as presentative from three independent experiments. j In vitro ubiquitination assays show that purified UBE3B induces polyubiquitination of purified MYC in the presence of UBCH3 (E2), ATP, Uba1 (E1), and biotinylated ubiquitin. The data are presented as presentative from three independent experiments. k In vitro ubiquitination assays show that UBE3B mildly induces polyubiquitination of MYC in the presence of UBCH3 (E2) but not in that of other E2s. The data are presented as presentative from three independent experiments. l Alignment of partial UBE3B sequences (1024–1049 amino acids in human UBE3B) from the indicated species. The cysteine at position 1036 (C1036) of human UBE3B was mutated to alanine (C1036A). In vitro ubiquitination assays showed that the UBE3B C1036A mutant did not induce polyubiquitination of MYC. The data are presented as presentative from three independent experiments. m Mapping UBE3B regions binding to MYC. Left: deletion mutants of UBE3B. Right: HEK 293T cells were cotransfected with the indicated constructs of UBE3B (His tag) and MYC (Flag tag). Cell extracts were IP with an anti-Flag Ab. The data are presented as presentative from three independent experiments. n In vitro assays show that the C terminus of UBE3B (UBE3B-C) mildly induces polyubiquitination of MYC. The data are presented as presentative from three independent experiments. o Pie chart shows all the types and statistics of UBE3B mutations in 89 lymphoma patients. p In vitro ubiquitination assays showed that the UBE3B R346Q mutation decreased the polyubiquitination of MYC compared with the wild-type MYC. The data are presented as presentative from three independent experiments. Source data are provided as a Source Data file. Image collected and cropped by CiteAb from the following open publication (https://pubmed.ncbi.nlm.nih.gov/33298911), licensed under a CC-BY license. Not internally tested by Novus Biologicals.
Western Blot: beta-Actin Antibody (AC-15) [NB600-501] -
GPR50 promotes ligand-independent activation of T betaRI signaling. a HEK293T cells expressing myc-Smad3, and GPR50 delta4 or GPR50wt were starved overnight and stimulated with TGF beta (2 ng/mL; 1 h). Smad3 phosphorylation was checked. Similar results were obtained in at least two additional experiments. b p-Smad2 detection in NCI-H520 cells following the silencing of GPR50 and T betaRI Control si-RNA (si-Ctrl) with and without TGF beta stimulation (2 ng/mL; 1 h) served as control. Densitometric analysis of three independent experiments (Mean ± s.e.m., n = 3 independent experiments, ***p < 0,001, one-way ANOVA with Dunnett’s post hoc test). c, d Detection of p-Smad3, p-Stat-3, p-Jak2 (c) and p-Smad2 (d) in lysates of hypothalamus and cortex of wt and GPR50ko mice. p-Smad2 was detected after precipitation of total Smad2/3. Quantification is shown on the right side of panel c. H hypothalamus, C cortex; Densitometric analysis of three independent experiments (Mean ± s.e.m., n = 3 independent experiments, **p < 0.01, two-tailed unpaired t-test). e Confocal images of HeLa cells expression GPR50 and T betaRI alone or together showing T betaRI colocalization with early endosome marker (EEA1) with TGF beta stimulation (scale: 10 µm). f (Left panel) Nuclear extracts of HEK293T cells treated with TGF beta (2 ng/mL, 1 h) and SB431542 (10 µM; O/N) and expressing indicated proteins. (Right) Densitometric analysis of three independent experiments (Mean ± s.e.m., n = 3 independent experiments, *p < 0.05, **p < 0.01, one-way ANOVA with Dunnett’s post hoc test). g HeLa cells were transfected with a a Firefly-Luciferase-coupled ARE- (together with FAST-2) reporter gene construct and Renilla Luciferase for normalization. The cells were transfected with empty (Mock± TGF beta; 0.5 ng/mL, 8 h) or 10, 50 and 100 ng of GPR50 delta4 and GPR50wt constructs (Mean ± s.e.m., n = 3 independent experiments, *p < 0.05, ***p < 0.001 one-way ANOVA with Dunnett’s post hoc test). h 4T1 cells stably expressing either empty plasmid (Mock) or GPR50∆4 were stimulated with TGF beta (2 ng/mL; 0, 8, 24 h). Snail expression was analyzed by immunoblotting. i HEK293T cells expressing indicated plasmids as in (a) and stimulated with TGF beta (2ng/mL, 1 h) to reveal p-p38 protein. Representative results are shown for a, d, e, h, i. Similar results were obtained in at least two additional experiments. See also Supplementary Fig. 2 Image collected and cropped by CiteAb from the following open publication (https://www.nature.com/articles/s41467-018-03609-x), licensed under a CC-BY license. Not internally tested by Novus Biologicals.
Western Blot: beta-Actin Antibody (AC-15) [NB600-501] -
No effect of T beta4 on upstream-deleted mutant of NPHP3-promoter (pmt.). (a) Mutant (mt.) NPHP3-promoter plasmids were prepared from wildtype (wt.) promoter. (b–e) HeLa cells were transfected with pCMV-2B or pCMV-T beta4 for 24 h. (b) HeLa cells were co-transfected with wildtype or mutant pEZX-PG02-NPHP3-promoter Gluc plasmid. And Gluc activity in cultured media was measured with luminometer using Gluc substrate. Bar graph indicates the mean of NPHP3-promoter activity. (c) Expression level of T beta4 and NPHP3 transcripts were measured by RT-PCR. (d) The cells were fixed and stained with antibody against Ac-tubulin (red) and DAPI (blue). (e) The ciliated cells in pCMV-2B- (white) or pCMV-T beta4-transfected group (grey) were counted. (f) Mutant (mt.) T beta4-promoter plasmids were prepared from wildtype (wt.) promoter. (g,h) HeLa cells were transfected with pCDNA3.1 or pCDNA6-NPH3 for 24 h. (g) HeLa cells were co-transfected with wildtype or mutant pEZX-PG02-T beta4-promoter Gluc plasmid. And Gluc activity in cultured media was measured with luminometer using Gluc substrate. Bar graph indicates the mean of T beta4-promoter activity. (h) Expression level of T beta4 and NPHP3 transcripts were measured by RT-PCR. Processing (such as changing brightness and contrast) is applied equally to controls across the entire image (c,d and h). Data in a bar graph represent the means ± SEM. **p < 0.01; significantly different from control group. &&p < 0.01; significantly different from wildtype promoter plasmid-transfected group. Image collected and cropped by CiteAb from the following open publication (https://pubmed.ncbi.nlm.nih.gov/31048733), licensed under a CC-BY license. Not internally tested by Novus Biologicals.
Western Blot: beta-Actin Antibody (AC-15) [NB600-501] -
GPR50 interacts with T betaRI and its expression is upregulated by TGF beta. a Tandem affinity purification of naive HEK293T cells stably expressing GPR50 delta4-TAP. After purification, mass spectrometry was employed for protein identification. b Left panel shows confocal images of GPR50 and T betaRI staining in the lining of the third ventricle of brain slices of wt (top) and GPR50ko mice (bottom). Right panel visualizes T betaRI/GPR50 interaction by proximity ligation assay (PLA) in the median eminence (ME) and third ventricle (3 V) of wt (top) and GPR50ko (bottom) mice (scale: 100 µm). White arrows depict immunoreactive (IR) regions. See also Supplementary Fig. 1a. c Confocal images of GPR50 (red) and T betaRI (green) staining in primary rat tanycytes (scale: 10 µm). d Colocalization of GPR50 (red) and T betaRI (green) in NCI-H520 cells. (scale: 10 µm). e Co-immunoprecipitation of GRP50 and T betaRI in lysates of primary rat tanycyte cultures. Lysates with IgG served as negative control. f Co-immunoprecipitation of GRP50 and T betaRI in the lysates of NCI-H520 after silencing either GPR50 (si-GPR50) or T betaRI (si-T betaRI). Control si-RNA (si-Ctrl) served as control. g, h Co-immunoprecipitation of GRP50 and T betaRI in lysates of MDA-MB231 cells (g) and cortex (h) isolated from wild type (wt) or GPR50ko mice. IgG served as negative control. i Upper part depicts schematic representation of BRET assay to study the interaction between T betaRI-Rluc8 and GPR50-YFP or T betaRI-YFP (left and middle scheme) and right scheme between T betaRI-Rluc8 and T betaRII-YFP. Lower part shows BRET donor saturation curves in HEK293T cells (left: constant expression level of T betaRI-Rluc8 and increasing levels of T betaRI-YFP, GPR50 delta4-YFP or GPR50wt-YFP; right: constant expression level of T betaRI-Rluc8 and increasing levels of GPR50 delta4-YFP or T betaRII-YFP with TGF beta stimulation (0.6 nM, 30 min at 37 °C)). IR-YFP and OBRa-YFP served as negative control. BRET signals were normalized to BRETmax values. Curves are obtained from three independent experiments performed in triplicates. j NCI-H520 cells were starved and stimulated for 24 h with TGF beta (2 ng/mL). GPR50 expression was checked by Immunoblotting and Q-PCR. (Mean ± s.e.m., n = 3 independent experiments, *p < 0.05; **p < 0.01, two-tailed unpaired Student’s t-test). Representative results are shown for e–h and i. See also Supplementary Fig. 1 Image collected and cropped by CiteAb from the following open publication (https://www.nature.com/articles/s41467-018-03609-x), licensed under a CC-BY license. Not internally tested by Novus Biologicals.
Immunocytochemistry/ Immunofluorescence: beta-Actin Antibody (AC-15) [NB600-501] -
AcAPE1 is exclusively associated with chromatin and remains bound to the condensed chromosomes. (A and B) Asynchronous normal lung fibroblast IMR90 cells and lung adenocarcinoma A549 cells were immunostained with anti-APE1 and anti-AcAPE1 Abs, counterstained with DAPI, and visualized by confocal microscopy and 3D SIM. (C) Colocalization of AcAPE1 with histone H3 or active enhancer-specific histone marker acetylated H3K27 (H3K27Ac). (D) BJ-hTERT cells were serum starved for 72 h and then fixed at different time points. Cells were immunostained with anti-APE1 and anti-AcAPE1 Abs and counterstained with anti-TO-PRO-3 iodide Ab. (E) Mitotic A549 cells were immunostained with anti-APE1 and anti-AcAPE1 and visualized by 3D SIM. (F) BJ-hTERT cells were either serum starved for 72 h (G0/G1 phase), treated with nocodazole (mitotic cells) or aphidicolin (G1/S phase synchronized cells), or untreated, and whole-cell extracts were isolated using 150 mM or 300 mM salt-containing lysis buffer. Western blot analysis for anti-APE1 and anti-AcAPE1 levels was performed. Anti-HSC70 was used as loading control. (G) A proximal ligation assay was performed with mouse anti-APE1 and rabbit anti-APE1 (mAPE1 & Rabbit-APE1), mouse anti-mouse APE1 and rabbit anti-AcAPE1 (mAPE1 & rAcAPE1), and rabbit anti-AcAPE1 and mouse anti-histone H3 (mHistone H3 & rAcAPE1) to confirm the chromatin association of AcAPE1. Mouse IgG (mIgG) and rabbit anti-AcAPE1 were used as a control. At least 50 cells were counted for PLA foci. (H) Colocalization of p300 and AcAPE1 on chromatin (DAPI). (I) HCT116 cells were transfected with E1A and mutant E1A, and at 48 h after transfection, IF was performed. Cells were immunostained with anti-p300 and anti-APE1 or anti-AcAPE1 and counterstained with DAPI. Image collected and cropped by CiteAb from the following open publication (https://pubmed.ncbi.nlm.nih.gov/27994014), licensed under a CC-BY license. Not internally tested by Novus Biologicals.
Western Blot: beta-Actin Antibody (AC-15) [NB600-501] -
Functional effects of CRISPR/Cas9-mediated ASXL1 mutation correction(A) Evaluation of ASXL1 protein expression by Western blotting. Left-hand side: ASXL1 protein expression in the SET2 leukemia cell line (wild-type for ASXL1), uncorrected KBM5 cells, the K562 leukemia cell line (carrying the Y591X heterozygous ASXL1 mutation), and KBM5 clones (labeled 1–5) with heterozygous precise correction of the ASXL1 mutation. Right-hand side: ASXL1 protein expression in the SET2 leukemia cell line (wild-type for ASXL1), uncorrected KBM5 cells, and KBM5 clones (labeled 1–5) with homozygous precise correction of the ASXL1 mutation. beta-actin was used as loading control. (B) Evaluation of the expression levels of HOXA genes using quantitative real-time PCR (q-RT-PCR). The expression levels of HOXA5, 6, 7, 9, 10 and 13 were measured in three ASXL1 homozygous corrected KBM5 clones compared with uncorrected cells. The results shown were obtained from six independent experiments for each clone. The values in ASXL1 homozygous corrected cells are relative to the uncorrected cells. Bar graphs show mean + standard error of the mean (s.e.m.) (* = P < 0.05, ** = P < 0.01, *** = P < 0.001, paired t-test). (C) Evaluation of H3K27me3 levels and expression of PRC2 components by Western blotting in uncorrected KBM5 cells and three KBM5 clones with homozygous correction of the ASXL1 mutation. H3K27me3 levels and total H3 levels were evaluated using purified histone fractions. The expression levels of two PRC2 components (EZH2, SUZ12) were determined using whole cell lysates. beta-actin was used as loading control. (D) Immunoprecipitation of BAP1 in the SET2 leukemia cell line (wild-type for ASXL1), uncorrected KBM5 cells, and three KBM5 clones with homozygous correction of the ASXL1 mutation. The BAP1 protein fraction was immunoprecipitated using a BAP1 antibody and stained for ASXL1 and BAP1. Image collected and cropped by CiteAb from the following open publication (https://www.oncotarget.com/lookup/doi/10.18632/oncotarget.6392), licensed under a CC-BY license. Not internally tested by Novus Biologicals.
Western Blot: beta-Actin Antibody (AC-15) [NB600-501] -
PRDX2 expression is regulated by HIF-1 and HIF-2A. HeLa cells were exposed to 20% or 1% O2 for 24 h. RT-qPCR assays were performed using primers specific for the indicated mRNAs. Data are shown as mean ± SEM, n = 3. ***p < 0.001 versus 20% O2. B. HeLa cells were exposed to 20% or 1% O2 for the indicated time. WCLs were subject to immunoblot assays with antibodies against PRDX2, HIF-1 alpha, HIF-2 alpha, and actin. The PRDX2 and actin bands were quantified by densitometry and normalized to 0 h (20% O2). Normalized data are shown as mean ± SEM, n = 3. *p < 0.05, ***p < 0.001 versus 20% O2. C. HeLa-shSC (SC), HeLa-shHIF-1 alpha(1 alpha), HeLa-shHIF-2 alpha(2 alpha), and HeLa-sh1 alpha+2 alpha (DKD) cells were exposed to 20% or 1% O2 for 72 h. WCLs were subject to immunoblot assays with antibodies against PRDX2, HIF-1 alpha, HIF-2 alpha, and actin. Image collected and cropped by CiteAb from the following open publication (https://www.oncotarget.com/lookup/doi/10.18632/oncotarget.7142), licensed under a CC-BY license. Not internally tested by Novus Biologicals.
Immunocytochemistry/ Immunofluorescence: beta-Actin Antibody (AC-15) [NB600-501] -
GAD65/67-positive neurons expressed HIF-1 alpha under hypoxic conditions. A) HIF-1 alpha expression co-localized with GAD65/67-ir in neurons exposed to hypoxia when compared to normoxia (upper panel) or GAD65/67-negative neurons in hypoxia (bottom panel, open arrow). B) Quantification shows the percentage of HIF-1 alpha-expressing GAD65/67-positive neurons after hypoxia in vitro (mean ± SD; from n = 6 cultures). C)In vivo immunostaining illustrates HIF-1 alpha-positive (bottom panel, solid arrow) and HIF-1 alpha-negative (bottom panel, open arrow) in GAD65/67-ir neurons in the ipsilateral region, whereas the contralateral region shows no HIF-1 alpha staining in GAD65/67-ir neurons (see Figure 1 for region selection). Scale bars, 10 μm (A); 20 μm (B). Image collected and cropped by CiteAb from the following open publication (https://actaneurocomms.biomedcentral.com/articles/10.1186/2051-5960-2-51), licensed under a CC-BY license. Not internally tested by Novus Biologicals.
Immunohistochemistry: beta-Actin Antibody (AC-15) [NB600-501] -
NDRG2 is correlated with increased survival and negatively correlated with GLUT1 in breast carcinoma. Kaplan–Meier analysis was carried out according to N-myc downstream-regulated gene 2 (NDRG2) expression levels of disease-free survival (A) and overall survival (B). (C) Serial immunostained sections for NDRG2 and glucose transporter 1 (GLUT1) in breast cancer and normal tissues were analysed. Original magnification, 40× (top) and 400× (bottom); scale bars = 50 μm. (D) Protein was extracted from matched breast tumour tissue (T) and adjacent normal tissue (N) and subjected to immunoblot analysis to examine NDRG2 and GLUT1 expression. beta-actin served as a loading control. P: patient. Relative expression levels of NDRG2 (E) and GLUT1 (F) in human breast cancer and adjacent normal tissue are shown. immunoreactivity score distribution of cancer and adjacent normal tissue were represented with black and brown closed circles, respectively. The horizontal lines presented are means; error bars represented SD from 30 samples. P < 0.01 was considered a statistically significant difference. Image collected and cropped by CiteAb from the following open publication (https://breast-cancer-research.biomedcentral.com/articles/10.1186/bcr3628), licensed under a CC-BY license. Not internally tested by Novus Biologicals.
Western Blot: beta-Actin Antibody (AC-15) [NB600-501] -
Characteristic expression of MTH1 in human gastric cancer tissues and ten digestive tract cancer cell lines.a The total RNA from fresh human gastric cancer tissues was isolated by RNApure Tissue&Cell Kit. The mRNA level of MTH1 in human gastric cancer (Increased, n = 21, Decreased, n = 6 and Unchanged, n = 8) and adjacent normal tissues (Con, n = 35) was determined by RT-PCR. The protein levels of MTH1 in human gastric (GC) and adjacent normal (GN) tissue sections were determined by immuohistochemistry (IHC) staining. The integral optical densities (IOD) were analyzed by Image-Pro Plus 6.0 software. b Representative IHC pictures of GC and GN. Scale bars, 50 μm. c IODs of GC and GN. n = 10 for each group. The cells from esophageal cancer cell lines: KYSE-450, EC109 and EC9706 (d, e), liver cancer cell lines: SMMC-7721, HepG2 and ZIP177 (f, g), gastric cancer cell lines: MGC-803, HGC-27, SGC-7901 and MKN45 (h, i), as well as the corresponding normal cell lines: Het-1A (d, e), L02 (f, g) and GES-1 (h, i) were cultured and lysed. The MTH1 protein levels were determined by Western Blot. GAPDH was used as a loading control. At least three independent experiments were performed for each group. j The cells indicated above were lysed and the total mRNA was extracted. The mRNA level of MTH1 was determined by RT-PCR. GAPDH was used as a control. At least three independent experiments were performed for each group. Data are presented as means ± SD. The symbol *, ** or *** stands for P < 0.05, P < 0.01 or P < 0.001 compared with the controls or normal cell groups Image collected and cropped by CiteAb from the following open publication (https://pubmed.ncbi.nlm.nih.gov/31164636), licensed under a CC-BY license. Not internally tested by Novus Biologicals.
Western Blot: beta-Actin Antibody (AC-15) [NB600-501] -
Glucose uptake and mitochondrial clustering following RT and CT. Glucose uptake (a,b) and mitochondrial clustering (c,d) was evaluated in A549 and A549RR cells before, 12 and 24 hours following radiation alone (RT) or combined radiation and YC-1 treatment. Immunoblotting was performed to verify HIF-1 alpha and PDK-1 inhibition (e–g). Sample immunoblots were cropped horizontally at indicated molecular weight. Uncropped exposures can be seen in supplemental Fig. 1. Significant differences (p < 0.05) are indicated by a bar starting and ending over groups that are different. Dashed line extends across at the mean of the A549 control prior to RT and without YC-1. RT – Radiation Treatment; CT – Combination treatment; ME – Main effect only with no significant interactions present; NS – No significant differences. Scale bar in images represents 50 μm. Image collected and cropped by CiteAb from the following open publication (https://www.nature.com/articles/s41598-018-27262-y), licensed under a CC-BY license. Not internally tested by Novus Biologicals.
Western Blot: beta-Actin Antibody (AC-15) [NB600-501] -
mTORC2 not mTORC1 regulates HIF‐2 alpha, GOT1 in PDAC under prolonged hypoxia. (A and B) HIF‐2 alpha mRNA and protein levels determined by qRT‐PCR (mRNA) and Western blot (protein) after treatment of Panc‐1 and Capan‐2 cells with mTORC1 inhibitor rapamycin for 48 hrs at 3% or 1% O2. beta‐Actin was used as loading control. (C and D) Panc‐1 and Capan‐2 cells were treated with mTORC1/mTORC2 inhibitor PP242 and cultured for 48 hrs at 20%, 3% or 1% O2, and HIF‐2 alpha, GOT1 mRNA and protein levels were determined by qRT‐PCR (mRNA) and Western blot (protein). beta‐Actin was used as loading control. Data are presented as mean ± S.D. from three independent experiments. *P < 0.05, **P < 0.01. Image collected and cropped by CiteAb from the following open publication (https://pubmed.ncbi.nlm.nih.gov/28544376), licensed under a CC-BY license. Not internally tested by Novus Biologicals.
Western Blot: beta-Actin Antibody (AC-15) [NB600-501] -
De-repression of Foxc1 following Ezh2 inhibition. a Hierarchical clustering of genes differentially expressed between Ezh2+/+ and Ezh2−/− Tet-ON PyVmt tumours (n = 5) using p < 0.05 and fold change > 1.5 cutoff. Red and blue indicate high and low expression of genes, respectively. b Heatmaps of signal intensity illustrating H3K27me3 ChIP-seq genomic mapping in a window of ±2.5 kb identified in Ezh2+/+ and Ezh2−/− Tet-ON PyVmt tumours. c Overlap between differentially upregulated genes in Ezh2−/− endpoint Tet-ON PyVmT tumours and genes identified by ChIP-seq to be targeted by H3K27me3. d Differential H3K27me3 levels in the upstream promoter region of Foxc1 in Ezh2+/+ vs. Ezh2−/− endpoint Tet-On PyVmT tumours. Image from the IGV browser. e Left- Significant upregulation of Foxc1 mRNA in Ezh2−/− Tet-ON PyVmT endpoint tumours compared to wild-type tumours. Right- Immunoblot of Ezh2+/+ or Ezh2−/− Tet-ON PyVmT endpoint tumours for Foxc1 and Ezh2 levels. Vinculin loading control. *p < 0.05, two tailed t-test. f qRT-PCR screen of Forkhead box family members in tumours lacking Ezh2. g Immunofluorescence staining of Foxc1 and Ezh2 in endpoint Ezh2+/+ or Ezh2−/− Tet-ON PyVmT tumours. Scale bars are 50 μm. h Chromatin immunoprecipitation enrichment of H3K27me3 at canonical PRC2 targets and the Foxc1 promoter in DMSO treated PyVmT cells which is lost in GSK-126 treated cells. *p < 0.05, two tailed t-test Image collected and cropped by CiteAb from the following open publication (https://pubmed.ncbi.nlm.nih.gov/29959321), licensed under a CC-BY license. Not internally tested by Novus Biologicals.
Western Blot: beta-Actin Antibody (AC-15) [NB600-501] -
Hypoxia induces the nuclear translocation of PRDX2 and PRDX4HeLa cells were transfected with vector encoding PRDX2-V5 (P2) or PRDX4-V5 (P4), or empty vector (EV), and exposed to 20% or 1% O2 for 48 h. Nuclear and cytosolic fractions were isolated and subject to immunoblot assays with antibodies against HIF-1 alpha, HIF-2 alpha, V5, alpha-tubulin, and histone H3. Image collected and cropped by CiteAb from the following open publication (https://www.oncotarget.com/lookup/doi/10.18632/oncotarget.7142), licensed under a CC-BY license. Not internally tested by Novus Biologicals.
Western Blot: beta-Actin Antibody (AC-15) [NB600-501] -
Release of peptidyl arginine deiminases (PADs) into the supernatant during NETosis, and detection of enzymatically active PADs. A, DNA release in peripheral blood neutrophils from healthy donors that were left unstimulated or stimulated with 25 mM phorbol myristate acetate (PMA) was assessed for up to 240 minutes after stimulation. Bars show the mean ± SD of 8 samples per group. B, For isolation of neutrophil extracellular traps, supernatants (SN) of unstimulated (unst.) or stimulated (stim.) neutrophils were collected. Subsequently, the cells were washed 3 times with RPMI medium (W1–W3), and stimulated cells were incubated in the absence or presence of DNase I; unstimulated cells treated with DNase I served as a control. Bars show the mean ± SD DNA concentration (conc) in 7 samples per group. C, Proteins (PAD2, PAD4, and neutrophil elastase [NE]) were precipitated from the same supernatants of unstimulated or stimulated cells as described in B and analyzed by Western blotting. Citrullinated proteins (citr.prot.) were detected using chemical modification and anti–modified citrulline antibody. PAD2 and PAD4 antibodies were tested for cross‐reactivity using human (hu) recombinant PAD4 (rPAD4) (250 ng) and human skeletal muscle tissue lysate (15 μg). One representative blot of 4 independent experiments is shown for each group. D, PAD activity in supernatants of unstimulated and stimulated cells was compared. Symbols represent individual donors (n = 10); bars show the median. ∗ = P < 0.05; ∗∗ = P < 0.01, by Wilcoxon's matched pairs signed rank test. AFU = arbitrary fluorescence units; NS = not significant. Image collected and cropped by CiteAb from the following open publication (https://pubmed.ncbi.nlm.nih.gov/26245941), licensed under a CC-BY license. Not internally tested by Novus Biologicals.
Western Blot: beta-Actin Antibody (AC-15) [NB600-501] -
Expression of FOXO increases in aging brain. (a) XY plots of FOXO1 or FOXO3 mRNA expression within the noted brain regions vs. age of the subjects at time of death. (b) Pearson correlation coefficients (r) and p‐values for the correlation of FOXO1 or FOXO3 mRNA expression in various regions of the human brain with the age. (c) The mRNA expressions of FOXO1 and FOXO3 were measured in human cerebellums (n = 33). Blue and green dots indicate samples used for WB in (d). The mRNA (e) and protein (f) expression of Foxo1, Foxo3, and phospho‐T24/32 Foxo1/3 in young (<3‐month, n = 6), adult (3‐18‐month, n = 6), and old (18–20‐month, n = 6) FVB/B6 mixed‐strain mouse cerebellums is shown. Each dot represents individual animal. Error bars, mean ± SEM. *p < .05; **p < .01; ***p < .005. Statistical significance was determined by unpaired t‐test. (g) FOXO1 IHC analysis of brain sections of WT and Foxo 1/3/4 KO mice. Residual FOXO1 immunoreactivity in KO mice is visible in endothelial cells (inset). Scale bar = 200 μm. (h) RT‐qPCR results for Foxo1 and Foxo3 mRNA. Empty bars represent WT, and colored bars represent KO tissues (n = 4). (i) Representative Western blotting results. Foxo1‐ or Foxo1/3‐specific knockouts (1KO or 1/3KO) selectively lost targeted isoforms. CBM—cerebellum, STR—striatum, SCD—spinal cord, CTX—cortex, BST—brain stem, MDB—midbrain, HPC—hippocampus Image collected and cropped by CiteAb from the following open publication (https://pubmed.ncbi.nlm.nih.gov/29178390), licensed under a CC-BY license. Not internally tested by Novus Biologicals.
Western Blot: beta-Actin Antibody (AC-15) [NB600-501] -
RIP2 is not essential for MAPK pathways in the early ontogenesis. (A) Immunoblot analysis of phospho-p44/42 MAPK, p44/42 MAPK, and p38 MAPK in larvae homogenate from WT and NOD1-1IS−/− zebrafish at 7 days post-fertilization (dpf). (B) Immunoblot analysis of phospho-p44/42 MAPK, p44/42 MAPK, and p38 MAPK in larvae homogenate from WT and RIP2−/− zebrafish at 7 dpf. (C) Immunoblot analysis of Atg5, p62, and LC3b in larvae homogenate from WT and NOD1-1IS−/− zebrafish at 7 dpf. (D) Immunoblot analysis of Atg5, p62, and LC3b in larvae homogenate from WT and RIP2−/− zebrafish at 7 dpf. Western blotting results were quantified using Quantity One software. Data represent the average of two independent experiments. *p < 0.05, **p < 0.01. Image collected and cropped by CiteAb from the following open publication (https://pubmed.ncbi.nlm.nih.gov/29692779), licensed under a CC-BY license. Not internally tested by Novus Biologicals.
Immunocytochemistry/ Immunofluorescence: beta-Actin Antibody (AC-15) [NB600-501] -
BubR1 associated PP2A, but not KNL1 associated PP1, plays a significant role in the end-on conversion process. a Experimental regime: BubR1 siRNA treated HeLa FRT/TO cells conditionally expressing Venus (YFP)-BubR1 (WT or ∆660–685 mutant) were exposed to Doxycycline for 24 h and MG132 for 1 h prior to immunostaining. b Images of cells treated as in a, immunostained with antibodies against GFP, Tubulin and Astrin and stained with DAPI for DNA. Scale: 5 µm in uncropped and 1 µm in cropped images. Boxed areas correspond to cropped images. c Graph of Astrin intensities on congressed or uncongressed kinetochores in cells expressing Venus (YFP) tagged -BubR1 WT or ∆660–685 mutant, as in b. Horizontal lines show average values (in green) across KTs from two independent experiments. Each circle represents values from one kinetochore. d Images of cells treated as in a, immunostained with antibodies against GFP and Tubulin and CREST anti-sera and stained with DAPI for DNA. Scale: 5 µm in uncropped and 1 µm in cropped images. Boxed areas correspond to cropped images. e Graph shows percentage of lateral vs. end-on kinetochores in Venus-BubR1 (WT or ∆660–685 mutant) expressing cells treated as in d. Each circle represents values from one cell. Black bar marks average values from four independent experiments. f Images of KNL1 siRNA treated HeLa cells expressing LAP-tagged KNL1 WT or mutants (2A or 4A). Following plasmid transfection, cells were exposed to Doxycycline for 1 h and then incubated in Doxycycline-free media for 30 h. Prior to fixation cells were exposed to MG132 for 45 min and immunostained with antibodies against GFP, Tubulin and Astrin. Scale: 5 µm in uncropped and 2 µm in cropped images. Boxed areas correspond to cropped images. g Graph shows percentage of lateral vs. end-on kinetochores in LAP tagged KNL1 (WT, 4A or 2A mutant) expressing cells, treated as in f. Each circle represents values from one cell. Black bar marks average values from three independent experimental repeats. In c, e and g, ‘*’ and # indicate statistically significant and insignificant differences, respectively (assessed using P-values from unpaired Student’s t-test) Image collected and cropped by CiteAb from the following open publication (https://pubmed.ncbi.nlm.nih.gov/28751710), licensed under a CC-BY license. Not internally tested by Novus Biologicals.
Western Blot: beta-Actin Antibody (AC-15) [NB600-501] -
Inflammasome proteins are elevated in the cytosolic fraction of aged mice: a Representative image of immunoblot analyses of inflammasome proteins in the cytosolic fraction of the cortex of young (Y) and aged (A) mice. Quantification of immunoblot analysis of NLRC4 (b), caspase-1 (c), ASC (d), IL-18 (e) in the cortex. a Representative image of immunoblot analyses of inflammasome proteins in the cytosolic fraction of the hippocampus of young (Y) and aged (A) mice. Quantification of immunoblot analysis of NLRC4 (g), caspase-1 (h), caspase-11 (i), ASC (j), IL-1 beta (k) in the hippocampus. Data presented as mean+/-SEM. N = 5 per group. *p < 0.05 Image collected and cropped by CiteAb from the following open publication (https://pubmed.ncbi.nlm.nih.gov/30473634), licensed under a CC-BY license. Not internally tested by Novus Biologicals.
Western Blot: beta-Actin Antibody (AC-15) [NB600-501] -
Downregulation of La autoantigen, hVAP-A, PSMA7, and NS5B leads to reduction in viral replication: overnight grown Huh-7.5 cells were transfected with La autoantigen, hVAP-A, and PSMA7 siRNAs for 48 h. Cells were then infected with the virus and again transfected with same siRNAs. After incubation total RNA was isolated and subjected to RT-PCR. NS5B siRNA was transfected once only after cells were infected. (a), (c), (e), and (g) represent RT-PCR results for target genes and NS5B gene upon treatment with La autoantigen, hVAP-A, PSMA7, and NS5B siRNAs, respectively. Densitometric analysis of (a), (c), (e), and (g) images is expressed in percentage in (b), (d), (f), and (h), respectively. The data represent mean ± standard deviation. ∗P value < 0.05 versus control considered statistically significant. Image collected and cropped by CiteAb from the following open publication (https://pubmed.ncbi.nlm.nih.gov/27446609), licensed under a CC-BY license. Not internally tested by Novus Biologicals.
Western Blot: beta-Actin Antibody (AC-15) [NB600-501] -
Inflammasome proteins are elevated in the cytosolic fraction of aged mice: a Representative image of immunoblot analyses of inflammasome proteins in the cytosolic fraction of the cortex of young (Y) and aged (A) mice. Quantification of immunoblot analysis of NLRC4 (b), caspase-1 (c), ASC (d), IL-18 (e) in the cortex. a Representative image of immunoblot analyses of inflammasome proteins in the cytosolic fraction of the hippocampus of young (Y) and aged (A) mice. Quantification of immunoblot analysis of NLRC4 (g), caspase-1 (h), caspase-11 (i), ASC (j), IL-1 beta (k) in the hippocampus. Data presented as mean+/-SEM. N = 5 per group. *p < 0.05 Image collected and cropped by CiteAb from the following open publication (https://pubmed.ncbi.nlm.nih.gov/30473634), licensed under a CC-BY license. Not internally tested by Novus Biologicals.
Western Blot: beta-Actin Antibody (AC-15) [NB600-501] -
S100A7 induces EMT in cervical cancer cellsWestern Blot showed the protein level of epithelial marker E-cadherin and mesenchymal markers (N-Cadherin, Vimentin, Fibronectin) and EMT transcription factors Snail and Slug after overexpression of S100A7 in C33A cells A. and SiHa cells B. beta-actin is used as a loading control. Image collected and cropped by CiteAb from the following open publication (https://www.oncotarget.com/lookup/doi/10.18632/oncotarget.15329), licensed under a CC-BY license. Not internally tested by Novus Biologicals.
Western Blot: beta-Actin Antibody (AC-15) [NB600-501] -
DNA damage and DNA damage responses upon H2O2 challenge. a, c, e, g Confocal images showing the basal region of the organ of Corti cultures treated with either culture medium alone (a, e) or containing 0.5 mM H2O2 (c, g) for 5 h before being maintained in culture medium alone for 3 days. The samples were then immunolabeled for myosin 7A (red, a, c, e, g), gammaH2AX (green, a and c) and 53BP1 (green, e and g). Scale bars: a, c, e and g = 10 μm. b, d, f, h Higher magnification images of representative OHC and IHC nuclei from all conditions tested. Scale bar = 2.5 μm. i Representative Western blot analysis using antibodies against gammaH2AX, 53BP1, DDB2, p-Chk1, p-Chk2, p53, and beta-actin in whole cochlear extracts. j, k Histograms representing the levels of gammaH2AX, 53BP1, DDB2, p-Chk1, p-Chk2, and p53 in control and in 0.4 and 0.5 mM H2O2-exposed groups (n = 6 cochleae per condition). beta-Actin served as a loading control. Data are expressed as mean ± SEM. One-way ANOVA test followed by post hoc Tukey’s test (*P ≤ 0.04, **P ≤ 0.01, ***P ≤ 0.001 vs. H2O2 0 mM). All experiments were performed in triplicate Image collected and cropped by CiteAb from the following open publication (https://pubmed.ncbi.nlm.nih.gov/30693443), licensed under a CC-BY license. Not internally tested by Novus Biologicals.
Western Blot: beta-Actin Antibody (AC-15) [NB600-501] -
Phagocyte infiltration contributes to the respiratory burst and consequent EPO signalling activation during inflammation resolution.ZymA (i.p., 1 mg per mouse) was applied to induce peritonitis in male WT mice. (a–c) Mice were treated with either 0.5 mg per mice i.p. of anti-Ly6G antibody or control (isotype control rat IgG2a) 1.5 day before zymA injection, and exudate leucocytes, peritoneum and peritoneal fluid were collected for analysis of ROS (a, n=3), hypoxia, HIF-1 alpha (b, n=3) and EPO (c, n=3) at 6 24 h. (d–f) Mice were treated with either anti-Ly6G antibody (0.5 mg per mice) plus clodronate liposomes (0.2 ml per 10 g) or control (isotype antibody+empty liposome) before zymA injection, and exudate leucocytes, peritoneum and peritoneal fluid were collected for analysis of ROS (d, n=3), hypoxia, HIF-1 alpha (e, n=3) and EPO (f, n=3) at 24 h. Representative data from two independent experiments are shown. For flow cytometry data, black numbers refer to the percentage of positive cells and red numbers refer to the mean fluorescent intensity. Error bars represent the s.e.m. *P<0.05, two-tailed unpaired Student's t-test. Full-size images for b and e are shown in Supplementary Fig. 12. Image collected and cropped by CiteAb from the following open publication (https://pubmed.ncbi.nlm.nih.gov/27397585), licensed under a CC-BY license. Not internally tested by Novus Biologicals.
Immunocytochemistry/ Immunofluorescence: beta-Actin Antibody (AC-15) [NB600-501] -
Association between Nup98-HoxA9 and Crm1 is critical for the Hox Gene activation mediated by Nup98-HoxA9.(A) Top panel: Nup98-HoxA9 interacts and sequesters Crm1 onto Nup98-HoxA9 dots. HeLa cells were transfected with the EGFP-Nup98-HoxA9 expressing plasmid. After 24 hr, cells were fixed and stained with an anti-Crm1 antibody. Arrows indicate the cells transfected. Bottom panel: Nup98-HoxA9 ES cells were fixed and co-stained with anti-FLAG (M2) and anti-Crm1 antibodies. Merged image of FLAG (green) and Crm1 (red) is shown. Bar, 5 μm. (B) The effect of LMB treatment on the cellular localization of Nup98-HoxA9. Nup98-HoxA9 ES cells were cultured either in the presence or absence of 5 nM LMB for 2 hr, fixed and stained with antibodies against FLAG (M2) and Crm1. Merged images of FLAG (green) and Crm1 (red) are shown. Nuclei were stained with DAPI. Bar, 10 μm. (C) Effect of LMB treatment on the regulation of Hox cluster genes. Nup98-HoxA9 ES cells were cultured in the presence or absence of 5 nM LMB for 3 or 6 hr and the expression of indicated genes was analyzed by qPCR. GAPDH was used as a reference gene. EGFP, enhanced green fluorescent protein; LMB, leptomycin B; qPCR, quantitative polymerase chain reaction.DOI:https://dx.doi.org/10.7554/eLife.09540.012Effect of LMB treatment on the FLAG-Nup98-HoxA9 protein level.Cell extracts of control (FLAG#1), Nup98-HoxA9 (clone#1), and Nup98-HoxA9 (clone#9) ES cells (equivalent of 105 cells) either incubated with LMB (5 nM, 2 hr) or left untreated were, loaded onto corresponding lanes. Immunoblotting was performed using an anti-FLAG or an anti-GAPDH antibody. ES, embryonic stem; LMB, leptomycin B.DOI:https://dx.doi.org/10.7554/eLife.09540.013Effect of LMB treatment on the cellular localization of various NupFG-HoxA9 fusions.ES cell clones expressing FLAG-tagged Nup153-HoxA9, Nu214-HoxA9, or HoxA9 were cultured in the presence or absence of 5 nM LMB for 2 hr, fixed and stained with an anti-FLAG (M2) antibody. Nuclei were stained with DAPI. Bar, 10 μm. DAPI, 4',6-diamidino-2-phenylindole; ES, embryonic stem; LMB, leptomycin B.DOI:https://dx.doi.org/10.7554/eLife.09540.014 Image collected and cropped by CiteAb from the following open publication (https://elifesciences.org/articles/09540), licensed under a CC-BY license. Not internally tested by Novus Biologicals.
Western Blot: beta-Actin Antibody (AC-15) [NB600-501] -
Dram1 is required for GFP-Lc3 targeting to Mm clusters.a, b Representative confocal micrographs and quantification of GFP-Lc3 puncta in dram1∆19n/∆19n and dram1+/+ larvae in an unstimulated situation (basal autophagy, a) and following BafA1 treatment b. Each larva was imaged at a pre-defined region of the tail fin (≥11 larvae/group). Results are accumulated from two independent experiments and represented by scatter and boxplots as detailed in the “Methods” section. ns non-significant, *p < 0.05,**p < 0.01,***p < 0.001. Scale bars, 10 μm. The intensity calibration bar for the Lookup table (LUT) is displayed in panel a. c–e Western blot analysis of autophagy. Protein samples were obtained from 4 dpf dram1∆19n/∆19n and dram1+/+ larvae (>10 larvae/sample). Lc3 c and e, or p62 and Optineurin d protein levels were detected in absence or presence of BafA1, c and d, or in the presence or absence of Mm e. Actin was used as a loading control. Western Blots were repeated three, c and d, or two e times with protein extracts derived from independent experiments. The Lc3II/Actin or p62/Actin and Optineurin/Actin ratio, normalized to the control sample, is indicated below the blots. f–g Representative confocal micrographs and quantification of GFP-Lc3 co-localization with Mm clusters in infected dram1∆19n/∆19n and dram1+/+ larvae. The top images f show the entire region of imaging, while the bottom images f′ and f″ show details of GFP-Lc3 colocalization of Mm clusters in dram1∆19n/∆19n and dram1+/+ larvae. The arrowheads indicate GFP-Lc3-positive Mm clusters. The data is accumulated from two independent experiments (≥15 larvae/group) and represented by scatter and boxplots as detailed in the “Methods” section. Scale bars, 10 μm. Image collected and cropped by CiteAb from the following open publication (https://pubmed.ncbi.nlm.nih.gov/32332700), licensed under a CC-BY license. Not internally tested by Novus Biologicals.
Western Blot: beta-Actin Antibody (AC-15) [NB600-501] -
Effects of in vitro hypoxia on the expression of mouse HIF-1 alpha in HIF-1 alpha+/- and HIF-1 alpha+/+ astrocytes. Confluent astrocyte monolayers of both cell types were exposed to a 6 h in vitro hypoxia. HIF-1 alpha mRNA expression was determined by RT-PCR as described in Materials and Methods. Each bar represents the mean ± SD of relative density/volumes of the bands on film negatives from at least three experiments. Asterisks and number sign indicate significant difference (p < 0.01; one-way ANOVA, followed by multiple comparisons among means). Image collected and cropped by CiteAb from the following open publication (https://pubmed.ncbi.nlm.nih.gov/17474992), licensed under a CC-BY license. Not internally tested by Novus Biologicals.
Western Blot: beta-Actin Antibody (AC-15) [NB600-501] -
TLR4 mRNA (a1) and protein (a2) expression in MM cell lines. (b) TLR4 mRNA expression of 16 CD138+ selected MM patients as determined by PCR and agarose gel electrophoresis. Probing with beta-ACTIN was used as total protein loading reference, whereas beta-ACTIN gene expression was used as reference for RNA input. beta-ACTIN probing and beta-ACTIN mRNA expression were used as reference for total protein and mRNA input, respectively. Image collected and cropped by CiteAb from the following open publication (https://pubmed.ncbi.nlm.nih.gov/30824741), licensed under a CC-BY license. Not internally tested by Novus Biologicals.
Western Blot: beta-Actin Antibody (AC-15) [NB600-501] -
SAN1 interacts with the RNA/DNA helicase sSenataxin. a Endogenous SAN1 was co-immunoprecipitated from HeLa WT and SAN1−/− after treatment with 1 μM MMC. Top panel: immunoblot (IB) of Senataxin inputs (lanes 1–2) and Co-IP (lanes 3–4), bottom panel: IB of SAN1 inputs (2%) (lanes 1–2), and Co-IP (lanes 3–4). b A stable HeLa cell line expressing near endogenous levels of a Senataxin-FLAG-GFP construct was transduced with a lentiviral construct of SAN1WT-Strep2-FLAG (SAN1ssf). Soluble nuclear fraction was isolated from the cells and SAN1 was captured on Strep-Tactin beads. Top panel: IB for Senataxin and SAN1 of precipitations from HeLa SETX-FLAG-GFP cell line +/- SAN1-ssf and +/- MMC. Bottom panel: Input IB for Senataxin, SAN1 and P-Chk2 from HeLa SETX-FLAG-GFP cell lines +/- SAN1-ssf, and +/- 1μM MMC. c, d CSAs of HeLa WT and SAN1−/− cells, transfected with scrambled ctrl or SETX siRNAs, in response to Cisplatin and MMC. Statistical significance determined by two-way ANOVA. Error bars denote s.e.m. *p < 0.05, **p < 0.01, ***p < 0.001, ****p < 0.0001. MMC CSA is shown in linear scale in d due to zero values at higher MMC concentrations. e IB of SETX siRNA knockdown. f Cells were fractionated to prepare the soluble nuclear fraction as in b and was captured on Strep-Tactin beads. Upper panel: IB of inputs for stable HeLa cell lines expressing near endogenous levels of a Senataxin-FLAG-GFP construct and over-expressing SAN1WT-Strep2-FLAG (SAN1ssf) or SAN1 lacking the central repeats region (SAN1 deltaRep-ssf). Lower panel: co-immunoprecipation of SETX-FLAG with SAN1WT-ssf but not SAN1 deltaRep-ssf. g, h CSAs for HeLa WT, SAN1−/−, and SAN1−/− +SAN1 deltaRep-ssf cells exposed to Cisplatin and MMC. Statistical significance determined by two-way ANOVA. i Quantification of nuclear R-loop intensity (N = 3). HeLa WT and SAN1−/− cells were treated with vehicle or 1 μM MMC and labeled with a monoclonal antibody to detect RNA/DNA hybrids (S9.6), nucleolin, and Draq5. Statistical significance calculated using unpaired t-test (N = 3 biological replicates, at least 60 cells per sample were analyzed). j Dot blot assay for quantification of RNA/DNA hybrids. (N = 4) Statistical significance determined by unpaired t-test comparing each condition to HeLa WT untreated Image collected and cropped by CiteAb from the following open publication (https://pubmed.ncbi.nlm.nih.gov/29968717), licensed under a CC-BY license. Not internally tested by Novus Biologicals.
Western Blot: beta-Actin Antibody (AC-15) [NB600-501] -
Probenecid reduces protein expression of NLRP1 inflammasome and ameliorates spatial learning deficits in aged rats. (A) Representative immunoblots of cleaved caspase-1, pannexin1 and P2X7R in hippocampal lysates of vehicle (Veh)-treated and probenecid (Pr)-treated 18-month-old rats. beta-tubulin was used as an internal control. (B) Densitometric analysis of immunoblots from brain lysates of cleaved caspase-1 (Casp1), P2X7 receptor (P2X7R), and pannexin1 (PanX1). (C-D) Aged animals underwent behavioral testing following either probenecid or vehicle treatment. (C) In a hippocampal-dependent spatial learning task via Morris water maze, latency to platform was measured on days 1-3 and 8-10. Probenecid-treatment improved latency to platform measured on the final day of testing (D) Mean path length was determined on day 10 of testing and probenecid-treated rats demonstrated significantly shorter mean path lengths than vehicle-treated controls. Drug treatment was administered twice daily for 3 days (days 7-9). Data are presented as mean +/- SEM *p < 0.05, **p < 0.005 compared to vehicle. N = 6-8/per group. Image collected and cropped by CiteAb from the following open publication (https://pubmed.ncbi.nlm.nih.gov/22133203), licensed under a CC-BY license. Not internally tested by Novus Biologicals.
Western Blot: beta-Actin Antibody (AC-15) [NB600-501] -
Representative image of Western blots (WB) analysis showing the specificity of the primary antibody rabbit anti-G protein-coupled receptor 55 (GPR55). The antibody revealed a single band of expected molecular weight (~40 kDa). The images of the different immunoblots were slightly adjusted in brightness and contrast to match their backgrounds. Image collected and cropped by CiteAb from the following open publication (https://pubmed.ncbi.nlm.nih.gov/31608295), licensed under a CC-BY license. Not internally tested by Novus Biologicals.
Immunocytochemistry/ Immunofluorescence: beta-Actin Antibody (AC-15) [NB600-501] -
Pot1a prevents DDR in HSCs. a, b Telomeric DDR in 8 week-old LSK cells upon Pot1a knockdown. a Immunocytochemical staining of TRF1 (green) and 53BP1 (red). Foci co-stained with TRF1 and 53BP1 were identified as TIFs. Nuclei were stained with TOTO3 (blue). Scale bar, 2 μm. b Frequency of TIFs per cell after 1 week of culture. Data are expressed as the mean ± SD (n = 100, *p < 0.01 by t-test). Representative data from three independent experiments are shown. c–f Telomeric DDR in donor-derived control-GFP or Pot1a overexpressing 8 week-old LSK cells 4 months post BMT. c Immunocytochemical staining of TRF1 (green) and 53BP1 (red). Nuclei were stained with TOTO3 (blue). Scale bar, 2 μm. d Frequency of TIFs per cell. Data are expressed as the mean ± SD (n = 120, *p < 0.01 by t-test). Representative data from 3 independent experiments are shown. e Immunocytochemical staining of TRF1 (green) and RPA32 (red). f Immunocytochemical staining of TRF1 (green) and pChk1 (red). Scale bar, 2 μm. g Flow cytometric analysis of Chk1 and pChk1 in donor-derived GFP+ LSKCD48–CD150+ cells after 5 months of 2nd BMT. Mean fluorescence intensity of Chk1 and pChk1 (left panels). Data are expressed as the mean ± SD (n = 3, *p < 0.01 by t-test). Representative FACS profiles of Chk1 and pChk1 in donor-derived GFP+ LSKCD48–CD150+ cells (right panels) Image collected and cropped by CiteAb from the following open publication (https://pubmed.ncbi.nlm.nih.gov/28986560), licensed under a CC-BY license. Not internally tested by Novus Biologicals.
Western Blot: beta-Actin Antibody (AC-15) [NB600-501] -
The UPR is activated in type II AECs isolated from IPF lungs. Phosphorylated IRE-1 alpha (panel A) and spliced XBP-1 (panel B) were present in increased amounts in AECs from 3 different IPF lungs, but not in the 3 control subjects (* P < 0.05, **P = 0.0495 by Wilcoxon rank sum test). # indicates amplicon of unspliced XBP1 digested with Pst1. Image collected and cropped by CiteAb from the following open publication (https://pubmed.ncbi.nlm.nih.gov/23167970), licensed under a CC-BY license. Not internally tested by Novus Biologicals.
Western Blot: beta-Actin Antibody (AC-15) [NB600-501] -
miR-18b (miR-18b-5p) regulates Hif1 alpha and reduces apoptosis in mtNSC-34 cells. a Overexpressed miR-18b (miR-18b-5p) decreased Hif1 alpha and Mef2c proteins. Both Mctp1 and Rarb expression were increased by miR-18b (miR-18b-5p). Downregulated Bax and upregulated Bcl2 by miR-18b (miR-18b-5p) diminished apoptosis in mtNSC-34 cells. b RT-qPCR analysis showed low expression of Hif1 alpha and Mef2c mRNAs. c Mctp1 and Rarb transcripts were highly expressed by miR-18b (miR-18b-5p). d Bax mRNAs were decreased and Bcl2 mRNAs were increased by overexpressed miR-18b. e miR-18b (miR-18b-5p) was overexpressed in mtNSC-34 cells. f miR-206 was reduced by miR-18b (miR-18b-5p). g LDH release analysis explained that transfected miR-18b (miR-18b-5p) restores apoptosis. h Luciferases assay with 3′ UTR of Hif1 alpha showed that Hif1 alpha is target of miR-18b in contNSC-34 cells. i and j Overexpression of miR-18b (miR-18b-5p) enhanced neuronal differentiation (MAP2) and attenuated intracellular Ca2+ levels (Cont (0.098) versus miR-18b (miR-18b-5p) (0.051) in fluorescence intensities from baseline 490/525 ratio) in mtNSC-34 cells. Empty vector served as a negative control (Cont). Arrow represents SOD1 aggregation (green). Scale bar, 40 μm. Significantly different at *, p < 0.05; **, p < 0.005. The experiments were replicated 5 times Image collected and cropped by CiteAb from the following open publication (https://pubmed.ncbi.nlm.nih.gov/32605607), licensed under a CC-BY license. Not internally tested by Novus Biologicals.
Immunocytochemistry/ Immunofluorescence: beta-Actin Antibody (AC-15) [NB600-501] -
NPC1 Disulfide bond-locked MLD and CTD fails to rescue cholesterol export from lysosomes.(A) Partial NPC1 structure; inset, close-up view of the MLD/CTD interface. The amino acid residues mutated to cysteines for disulfide bond formation are shown and highlighted in red. (B) Confocal immunofluorescence microscopy analysis of mouse NPC1-A521C/K1013C and LAMP1 proteins in HeLa cells (bar, 20 μm). White boxes in images indicate regions of cells enlarged in the insets shown at the lower right of each image. (C) Confocal immunofluorescence microscopy of cholesterol accumulation rescue for NPC1-A521C or mouse NPC1-A521C/K1013C. (D) Flow cytometry of the rescue experiment analyzed in (C). GFP-positive cells with similar expression levels were analyzed: 17746 NPC1-/- cells; 1315 NPC1 wild type; 1137 NPC1-A521C/K1013C cells; 837 NPC1-A521C cells; cell numbers were normalized for comparison.Extracted ion chromatograms from LC-MS analysis of proteolyzed A521C/K1013C NPC1.Protein was carbamidomethylated in the presence or absence of reducing agent prior to deglycosylation and proteolysis. In both samples, blue traces represent m/z = 596.2818 (corresponding to the NPC1 peptide APCSLNDTSLL carbamidomethylated at the engineered cysteine A521C and deamidated at the N524 glycosylation site). Image collected and cropped by CiteAb from the following open publication (https://pubmed.ncbi.nlm.nih.gov/32410728), licensed under a CC-BY license. Not internally tested by Novus Biologicals.
Western Blot: beta-Actin Antibody (AC-15) [NB600-501] -
Identification of alternative BPTF species in human cancer cells.(A) Reactivity of anti-BPTF antibodies with lysates from human cancer cells. Cell line-specific patterns were observed, with bands of the same mobility being detected across lines and detected with independent antibodies. The findings suggest the occurrence of multiple BPTF-related protein species in human cancer cells. A representative western blot is shown. (B) Gel bands selected for BPTF Mass Spectrometry identification according to the localization of the BPTF signal detected by western blotting in MCF-7 cells. (Left, NP-40 lysis buffer, gel bands A1 and A2; Right, Laemmli buffer, B1 and B2). The detection of low molecular weight species upon direct cell lysis in Laemmli buffer strongly supports the notion that the findings do not result from artifactual proteolysis. (C) Sequence coverage of BPTF protein. Peptides identified by LC-MS/MS are highlighted in color. (D) BPTF peptide intensity (arbitrary units) calculated by MaxQuant in the gel bands A1, A2/B1, B2. Image collected and cropped by CiteAb from the following open publication (https://pubmed.ncbi.nlm.nih.gov/31498079), licensed under a CC-BY license. Not internally tested by Novus Biologicals.
Immunohistochemistry: beta-Actin Antibody (AC-15) [NB600-501] -
Correlation of MAP17 expression with inflammation (CD45) in human samples of tumors of different originMAP17 and CD45 staining of serial sections of human samples of tumors of different origin. MAP17 staining in all samples showed high expression levels, correlated with the inflammatory marker CD45. Image collected and cropped by CiteAb from the following open publication (https://pubmed.ncbi.nlm.nih.gov/29228712), licensed under a CC-BY license. Not internally tested by Novus Biologicals.
Immunohistochemistry: beta-Actin Antibody (AC-15) [NB600-501] -
Intraperitoneally Administered Compound A Effectively Suppresses Triple-Negative Breast and Blood Cancer Xenograft Tumor Growth. Immunocompromised mice were subcutaneously injected with cancerous cell lines and tumors were allowed to establish. Treatments occurred every other day and the studied compound or the equivalent vehicle control administered intraperitoneally for five weeks. Tumor volume and mass were measured two times per week. (a) MV-4-11 xenograft study was administered with approximately 5.0 mg/kg of Compound A and 5.0 mg/kg of curcumin. Results are representative for the Control (n = 5), Compound A (n = 5), and curcumin (n = 4) treated group, each with two tumors per mouse. (b) MDA-MB-231 xenograft study was administered with approximately 7.5 mg/kg of Compound A. Results are representative for the Control (n = 3) and Compound A (n = 4), each with one tumor per mouse. Scale bar is 1 centimeter. (c) Immunohistochemistry analysis of sectioned tumor tissues from the MDA-MB-231 study. Each section was subjected to the specified antibody followed by a biotinylated secondary antibody. Detection was done using a DAB Peroxidase HRP Substrate Kit (brown) followed by Hematoxylin counterstaining (purple). Images were obtained using inverted bright field microscopy. Sectioning results are representative of three individual tumors. Scale bar is 50 microns. Statistical analysis using One-Way ANOVA. *p < 0.05 vs tumor volume of the control. Image collected and cropped by CiteAb from the following open publication (https://pubmed.ncbi.nlm.nih.gov/28439094), licensed under a CC-BY license. Not internally tested by Novus Biologicals.
Western Blot: beta-Actin Antibody (AC-15) [NB600-501] -
The FAN1 PIP-box motif is not required for FAN1 foci formation upon exposure to MMC. a Total cell extracts and chromatin-enriched fractions of U2OS cells expressing the indicated eGFP-FAN1 variants, treated or mock-treated with MMC (150 ng/ml, 24 h), were analysed by immunoblotting using the indicated antibodies. A representative blot of three independent experiments is shown. b Cells as in a were immunostained with anti-FANCD2 antibody. Representative images are shown. Scale bar: 25 μm. c, d Quantification of eGFP-FAN1 foci count (c) and the sum of their intensities (d) was obtained from QIBC analysis of b. Median levels are indicated by black bars. Statistical analyses were carried out using unpaired, two-tailed t-tests. P values expressed as ***(P < 0.01) were considered significant, n = 3. e Total cell extracts derived from cells as in a, treated or mock-treated with MMC (150 ng/ml, 24 h), were incubated with anti-eGFP affinity resin. Inputs and immunoprecipitates were analysed by immunoblotting with the indicated antibodies. A representative blot of two independent experiments is shown Image collected and cropped by CiteAb from the following open publication (https://pubmed.ncbi.nlm.nih.gov/29051491), licensed under a CC-BY license. Not internally tested by Novus Biologicals.
Western Blot: beta-Actin Antibody (AC-15) [NB600-501] -
Activation receptors are shed during intrinsic repair. (A) BMDM were unchallenged (control) or challenged with 500 HU/mL SLO WT, PFO or an equivalent mass of SLO ML for 10 min at 37 °C and centrifuged at 2000 × g for 5 min to yield cell pellet (C). Supernatants were spun at 100,000xg for 40 min at 4 °C to collect the high speed supernatant (S) and microvesicle pellet (M). Samples were solubilized at 95 °C in SDS-sample buffer, resolved by SDS-PAGE and transferred to nitrocellulose. Portions of the blot were probed with 6D11 anti-SLO, anti-IFN gammaR1, 4B4F12 anti-CD14, 76B357.1 anti-TLR4, O91B8 anti-MyD88, 1H4B01 anti-Trif, EPR4477 anti-Alkaline Phosphatase, MANLAC-4A7 anti-Lamin A/C, and AC-15 anti-beta -Actin antibodies followed by relevant secondary antibodies and ECL. Full-length blots are presented in Supplementary Figure S1. (B) BMDM were challenged with 500 HU/mL SLO WT or SLO N402C, SLO ML at equivalent mass to SLO WT, or SLO N402E at equivalent mass to SLO N402C for 10 min. Cell pellets (C), high speed supernatants (S) and microvesicles (M) were isolated as in (A) and probed with 6D11 anti-Streptolysin O, 76B357.1 anti-TLR4, O91B8 anti-MyD88, 1H4B01 anti-Trif, EPR4477 anti-Alkaline Phosphatase, MANLAC-4A7 anti-Lamin A/C, and AC-15 anti-beta -Actin antibodies. Full-length blots are presented in Supplementary Figure S2. The blots are representative of at least 3 independent experiments. Image collected and cropped by CiteAb from the following open publication (https://www.nature.com/articles/s41598-018-24955-2), licensed under a CC-BY license. Not internally tested by Novus Biologicals.
Western Blot: beta-Actin Antibody (AC-15) [NB600-501] -
Effects of Lycium barbarum polysaccharides (LBP) and capsaicin (CAP) on colonic (A) Cyclooxygenase-2 (COX-2), (B) Transient receptor potential cation channel V1 (TRPV1), and (C) Transient receptor potential ankyrin 1 (TRPA1) protein expression. (D) Representatives of Western blot for COX-2, TRPV1, TRPA1, and beta-actin. N: control group, U: ulcerative colitis induced group, L: LBP treated group, C: CAP treated group, M: mixed LBP and CAP treated group. Data are presented as mean ± SEM and analyzed by one-way ANOVA and Fisher’s least significant difference test (n = 8). # p < 0.05 compared to the N group. * p < 0.05 compared to the U group. Image collected and cropped by CiteAb from the following open publication (https://pubmed.ncbi.nlm.nih.gov/35269566), licensed under a CC-BY license. Not internally tested by Novus Biologicals.
Western Blot: beta-Actin Antibody (AC-15) [NB600-501] -
Expression of RPE-specific marker proteins in hPSC-RPE and iPSC-RPE cells.(a–b) Immunoblotting showing the expression of RPE-specific proteins BEST1, RPE65, CRALBP, and the loading control beta-Actin in hPSC-RPE (a) and iPSC-RPE (b) cells. Two gels/blots in the same panel were prepared from the same cell lysate of each PSC-RPE to detect BEST1 + beta-Actin, and RPE65 + CRALBP, respectively. Image collected and cropped by CiteAb from the following open publication (https://pubmed.ncbi.nlm.nih.gov/34061021), licensed under a CC-BY license. Not internally tested by Novus Biologicals.
Western Blot: beta-Actin Antibody (AC-15) [NB600-501] -
A-type lamin depletion inhibits DNA repair and reduces cellular fitness to DNA damage. (A) Wild-type (WT) or Y259X HDF were treated with the proteasome inhibitor MG-132 (30 μm). Cell extracts were prepared and levels of 53BP1 were assessed by immunoblotting. beta-tubulin was a loading control. WCE, whole cell extract. The relative levels of 53BP1 were expressed relative to the levels of untreated WT HDF (1.00). In untreated Y259X cells, 53BP1 levels fell to 15% and were restored to ∽50% following treatment with MG-132. (B) Cell extracts were prepared from WT and Y259X HDF and assessed by immunoblotting with the indicated antibodies. Shown is a representative set of blots from two independent experiments. (C) WT and Y259X HDF were biochemically extracted into cytoplasmic and nuclear fractions before immunoblotting for levels of 53BP1. (D) HDF and Y259X cells were treated with IR (3 Gy), fixed at the times indicated and stained with gamma-H2AX antibody. The number of gamma-H2AX foci at each time point was quantified and data represents the mean ± SD from three independent experiments. (E) U2OS cells were transfected with siCTRL or siLMNA siRNA and plated onto 60-mm dishes. The cells were then exposed to varying doses of IR and fixed 12 days later in a solution containing crystal violet. The surviving fraction at each IR dose was calculated based on the plating efficiency of the untreated plates. Data represent the mean ± SD from three independent experiments. (F) HDF or Y259X cells were treated with DMSO or KU55933 ATM inhibitor (10 μm) before exposure to the indicated doses of IR then fixed, processed and stained with gamma-H2AX antibody. Residual gamma-H2AX foci were enumerated and the data represent the mean ± SD from three independent experiments. (G) HDF or Y259X cells were exposed to IR, briefly extracted with CSK buffer and processed for immunofluorescence with gamma-H2AX and pKAP-1 antibodies. Scale bar, 10 μm. Image collected and cropped by CiteAb from the following open publication (https://pubmed.ncbi.nlm.nih.gov/25645366), licensed under a CC-BY license. Not internally tested by Novus Biologicals.
Western Blot: beta-Actin Antibody (AC-15) [NB600-501] -
Induction of CIP2A mRNA and protein expression by HPV‐16E6 in PHKs. A, mRNA expression of HPV‐16E6 in PHKs expressing 16E6 and F2V using beta‐actin as a loading control. B, Protein levels of HPV‐16E6, p53 and p21 in PHKs expressing 16E6 and F2V. Expression of GAPDH was used as a loading control. A representative of 2 independent experiments is shown. C, HPV‐16E6 expression leads to increased protein expression of CIP2A in PHKs. Data from a representative of 3 experiments are shown. D, Data from 3 experiments are summarized. E, Relative CIP2A mRNA expression was determined by qRT‐PCR in the above cells. Data from 3 experiments are summarized. The mean and standard deviation (SD) of 3 independent experiments are shown. Babe, pBabe‐puromycin vector. *, P < .05; **, P < .01; and ***, P < .001 Image collected and cropped by CiteAb from the following open publication (https://pubmed.ncbi.nlm.nih.gov/29893470), licensed under a CC-BY license. Not internally tested by Novus Biologicals.
Immunocytochemistry/ Immunofluorescence: beta-Actin Antibody (AC-15) [NB600-501] -
RES rescued DXR-induced apoptosis through DNA-damage-P63-Caspase3 pathway in mouse oocytes. (A) Representative immunofluorescence images showing the expression of gamma-H2AX in mouse oocytes. Green, gamma-H2AX, Blue, DNA, Bar = 20 μm. (B) The relative immunofluorescence intensity of gamma-H2AX was measured in control, DXR-treated and RES-supplemented oocytes. Experiments were repeated at least 3 times with more than 30 oocytes examined for each group. Data were presented as means ± S.E.M of three independent experiments. **means P < 0.01, *** means P < 0.001. (C) Protein levels of gamma-H2AX, P63 and Active-Caspase3 were examined by Western blotting in control, DXR-treated and RES-supplemented oocytes. GAPDH was used as a loading control. The clean backgrounds for the active-Caspase-3, gamma-H2AX and GAPDH is due to the exposure. Image collected and cropped by CiteAb from the following open publication (https://pubmed.ncbi.nlm.nih.gov/32352929), licensed under a CC-BY license. Not internally tested by Novus Biologicals.
Immunocytochemistry/ Immunofluorescence: beta-Actin Antibody (AC-15) [NB600-501] -
MUS81 inhibition in BRCA2-deficient cells causes accumulation of 53BP1 nuclear bodies and G1 arrest.(a) H1299 cells carrying a DOX-inducible BRCA2 shRNA were transfected with control or MUS81 siRNAs. Representative images of cells processed 72 h later for immunostaining with anti-53BP1 (green) and anti-cyclin A (red) antibodies. DNA was counterstained with DAPI. Scale bar, 10 μm. (b) Quantification of the frequency of cyclin A-negative G1 cells containing >5 53BP1 nuclear bodies in cells treated as in a. Similar analyses were conducted using stable cells lines expressing either WT or CI human MUS81. Error bars represent s.d. (n=3). *P<0.05; **P<0.01; ***P<0.001 (unpaired two-tailed t-test). (c) Quantification of G1, S and G2 cell populations (boxed) in asynchronous cultures of EdU-labelled cells treated as in a. PI, propidium iodide. Image collected and cropped by CiteAb from the following open publication (https://www.nature.com/articles/ncomms15983), licensed under a CC-BY license. Not internally tested by Novus Biologicals.
Western Blot: beta-Actin Antibody (AC-15) [NB600-501] -
ATG5 and ATG7 enhanced autophagy and inhibited ER stress in chondrocyte. a Western blotting analysis of LC3, P62, ATG5, ATG7 and ATG5-ATG12 expression after infected with Ad-ATG5, Ad-ATG7 and Ad-ATG5 + Ad-ATG7 in the C28I2 cells. beta-actin is served as an internal control. b Qualitative analysis of ATG5, ATG7, ATG5-ATG12, LC3 and P62. The values were normalized to beta-actin. c C28I2 cells were double stained with LC3 (red) and DAPI (blue) and visualized by confocal microscopy (400X) after treated with Rapamycine, Ad-ATG5, Ad-ATG7 and Ad-ATG5 + Ad-ATG7 24 h. *P < 0.05, **P < 0.01 compared with the controls. Values are means ± SD n = 3). d Qualitative analysis of LC3 fluorescence intensity of chondrocytes. The values were normalized to the NC group. e Western blotting analysis of PERK, p-PERK and Nrf2 expression after infected with Ad-ATG5, Ad-ATG7 and Ad-ATG5 + Ad-ATG7 in the C28I2 cells. beta-actin is served as an internal control. f Qualitative analysis of PERK, p-PERK and Nrf2 were normalized to beta-actin. (1:NC, 2:Ad-GFP, 3:Ad-ATG5, 4:RAPA, 5:Ad-ATG7, 6:Ad-ATG5 + RAPA, 7:Ad-ATG5 + Ad-ATG7). Rapamycin (25 μM) used as a positive control Image collected and cropped by CiteAb from the following open publication (https://pubmed.ncbi.nlm.nih.gov/31060556), licensed under a CC-BY license. Not internally tested by Novus Biologicals.
Western Blot: beta-Actin Antibody (AC-15) [NB600-501] -
High autophagosome concentration is consumed during early immortalized human mesenchymal stem cell differentiation. (A) Immortalized human mesenchymal stem cells were differentiated under osteogenic conditions (see Materials and methods) and assayed for changes in LC3I and LC3II during a 72-hour window. Cells were differentiated under standard conditions (top) or with addition of 5 μM rapamycin (middle) or 5 nM bafilomycin (bottom) for the first 3 hours of differentiation to modulate autophagy. Immunoblots were performed for LC3 at the indicated time points to assess autophagosome degradation via relative changes in LC3II (lower band; 17 kDa). Studies were repeated three times with similar trends seen consistently. (B) Average standardized densities normalized by the sum of replicates were quantified via densitometry to measure autophagosome accumulation (LC3II bands) across three separate differentiations. Average values as standardized to beta-actin are reported here. LC3, light chain 3. Image collected and cropped by CiteAb from the following open publication (https://pubmed.ncbi.nlm.nih.gov/25523618), licensed under a CC-BY license. Not internally tested by Novus Biologicals.
Immunohistochemistry-Paraffin: beta-Actin Antibody (AC-15) [NB600-501] -
Valvular endothelial cell (VEC) markers. Sections of the sheep aortic valve leaflet stained with antibodies against the endothelial cell markers CD31, CD34, VE-Cadherin (CD144), or von Willebrand Factor (vWF). Represented are the aortic wall and a section of the valvular leaflet (near the free edge), with “a” and “v” indicating the aortic and ventricular sides of the leaflet, respectively. Scale bars, 100 μm. Image collected and cropped by CiteAb from the following open publication (https://pubmed.ncbi.nlm.nih.gov/30159315), licensed under a CC-BY license. Not internally tested by Novus Biologicals.
Western Blot: beta-Actin Antibody (AC-15) [NB600-501] -
Role of NADPH oxidases in IH-induced HIF-2 alpha degradation. A. Effect of NADPH oxidase (Nox) inhibitors Apocynin (Apo, 1 mM) and AEBSF (15 µM) on HIF-2 alpha protein following exposure to IH. B. HIF-2 alpha expression in PC12 cells transfected with Nox2 and Nox4 siRNA and exposed to normoxia (N) or IH. Tubulin expression was monitored as control for protein loading. Bottom panels of A and B represent average data of densitometric analysis of the immunoblots presented as mean ± S.E.M from three independent experiments. *p<0.05; n.s. not significant, p>0.05. Image collected and cropped by CiteAb from the following open publication (https://pubmed.ncbi.nlm.nih.gov/24124516), licensed under a CC-BY license. Not internally tested by Novus Biologicals.
Western Blot: beta-Actin Antibody (AC-15) [NB600-501] -
Tamoxifen administration-induced PHD2 deletion in skeletal muscle in Phd2f/f/Rosa26CreERT2 mice. a. PHD1, 2, and 3 deletion efficiency in the gastrocnemius muscles of tamoxifen-treated Phd2f/f/Rosa26CreERT2 mice was determined using qRT-PCR. Relative gene expression was determined using gastrocnemius muscle tissue cDNA (n = 3–4 mice per group). b. Anti-PHD2 and PHD3 Western blotting of gastrocnemius and soleus muscles at 6 weeks after tamoxifen administration. c. The expression of HIF-1 alpha in gastrocnemius and soleus at 5 weeks after tamoxifen administration. d. The level of hif-1 alpha mRNA in gastrocnemius at 5 weeks after tamoxifen administration. *p < 0.05; **p < 0.01 compared to control. Values are means ± SEM Image collected and cropped by CiteAb from the following open publication (https://pubmed.ncbi.nlm.nih.gov/26949511), licensed under a CC-BY license. Not internally tested by Novus Biologicals.
Western Blot: beta-Actin Antibody (AC-15) [NB600-501] -
Effect of silencing Cx43 on the expression of HIF-1 alpha in astrocytes.Astrocytes were transfected with NT-siRNA or with Cx43-siRNA. At the indicated times the expression of HIF-1 alpha and Cx43 was analysed by Western blot. A) Representative Western blot of HIF-1 alpha, Cx43 and GAPDH showing that the decrease in Cx43 expression was concomitant with HIF-1 alpha up-regulation. B) HIF-1 alpha quantification. C) Cx43 quantification. The results are expressed as percentages of the level found in the NT-siRNA condition at time 0. ***p<0.001 versus the corresponding NT-siRNA values. Image collected and cropped by CiteAb from the following open publication (https://dx.plos.org/10.1371/journal.pone.0032448), licensed under a CC-BY license. Not internally tested by Novus Biologicals.
Western Blot: beta-Actin Antibody (AC-15) [NB600-501] -
Analysis of NS5B protein expression after transfecting NS5B and La autoantigen siRNAs: HCV-infected Huh-7.5 cells were treated with siRNAs against La autoantigen and NS5B as mentioned above. After 48 h total cellular protein was isolated and subjected to western blot analysis. (a) indicates downregulation of La autoantigen (upper gel) and NS5B (middle gel) and beta-actin (lower gel). (b) represents densitometric analysis of La autoantigen and HCV NS5B expressed in percentage. Immunofluorescence of NS5B from single and combination of siRNAs transfected cells as represented in (c) where row (A) indicates cells in bright field and row (B) is the merging of DAPI and FITC stained cells. Image collected and cropped by CiteAb from the following open publication (https://pubmed.ncbi.nlm.nih.gov/27446609), licensed under a CC-BY license. Not internally tested by Novus Biologicals.
Western Blot: beta-Actin Antibody (AC-15) [NB600-501] -
SLD-LPS-mediated Keap1 accumulation is correlated with a pro-inflammatory monocyte phenotype. BMDMs were treated with either PBS or SLD-LPS (100 pg/mL) for 5 days. (A) Representative Co-IP result with no lysate IP (just antibody and beads) (Con.) and the whole cell lysate input (WCL) controls. Keap1 antibody was used to pull-down Nrf2 (upper blot), and Nrf2 was used to pull down Keap1 (lower blot). See Supplemental Figures S3, S4 for un-altered blots. (B–D) The levels of Ly6C (B), Keap-1 (C), and CD200R (D) were analyzed and quantified using geometric mean fluorescence intensity (MFI) by flow cytometry. (E–G) Representative western blots of IKK beta (E), p-p65 (S536) (F), and total NF-kappa B p65 (G) in monocytes with quantification on the left. (H) p-p65/total p65 ratio. All data are representative of at least 3 separate experiments (n = 3, except for IKK-beta where n = 5). Unpaired student t-test. *p < 0.05, **p < 0.01, ***p < 0.001, ****p < 0.0001. Image collected and cropped by CiteAb from the following open publication (https://pubmed.ncbi.nlm.nih.gov/32765513), licensed under a CC-BY license. Not internally tested by Novus Biologicals.
Western Blot: beta-Actin Antibody (AC-15) [NB600-501] -
Effect of alcohol on TERT expression in vitro.Acute alcohol treatment of RAW 264.7 cells can be achieved with 25 mM EtOH for 24 h. (a) TERT mRNA and protein expression in EtOH-stimulated RAW 264.7 cells were analyzed by real-time PCR and western blot. The results are shown as relative expression against control expression without treatment. The values represent means ± SD. *P < 0.05, **P < 0.01 vs control. #P<0.05, ##P<0.01 vs EtOH-treated group. (b) Effect of alcohol on M1 macrophage markers (TNF-alpha, IL-1 beta, CCL2 and NOS2) in RAW 264.7 cells without or with LPS stimulation. (c) Effect of alcohol on M2 macrophage markers (Arg-1, IL-10, Mrc2 and CD163) in RAW 264.7 cells without or with LPS stimulation. (d) Effect of alcohol on the production of cytokines including TNF-alpha, IL-1 beta, IL-6, IL-12 and IL-10 in RAW 264.7 cells without or with LPS stimulation. The results are shown as line chart. Image collected and cropped by CiteAb from the following open publication (https://pubmed.ncbi.nlm.nih.gov/26725521), licensed under a CC-BY license. Not internally tested by Novus Biologicals.
Western Blot: beta-Actin Antibody (AC-15) [NB600-501] -
Widespread dysregulation of shelterin protein expression in bortezomib-treated HEL and BGC-823 cellsA. and B. mRNA levels of shelterin factors TRF1, TRF2, TPP1, POT1, RAP1 and TIN2 in bortezomib-treated cells. Cells were treated with bortezomib for 24 hours and qPCR was used for quantitative assays. The levels of each target mRNA in bortezomib-treated cells were expressed as percentages of those in untreated cells. (A) HEL cells and (B) BGC-823 cells. C. and D. Immunoblotting assessment of TRF1, TRF2 and POT1 protein expression in bortezomib-treated cells. Same sets of cells above were analyzed for TRF1, TRF2 and POT1 protein levels and shown was representative of three independent experiments. (C) HEL cells and (D) BGC-823 cells. * and **: P < 0.05 and 0.01, respectively. BTZ, bortezomib. Image collected and cropped by CiteAb from the following open publication (https://www.oncotarget.com/lookup/doi/10.18632/oncotarget.5752), licensed under a CC-BY license. Not internally tested by Novus Biologicals.
Western Blot: beta-Actin Antibody (AC-15) [NB600-501] -
AMPK‐activating AICAR treatment activates FANCD2, a pivotal molecule of Fanconi anemia DNA damage signaling pathway. (A) AICAR treatment induces FANCD2 monoubiquitination in transformed normal fibroblasts (GM00637I). GM00637I cells were treated with 1 mm 2‐deoxyglucose, 0.25 mM AICAR, or 1 mm phenformin for 24 h. Lysates were subjected to western blotting with anti‐FANCD2, phospho‐AMPK alpha1 (T172), and AMPK alpha and beta‐actin. In FANCD2 blots, the position of monoubiquitinated FANCD2 (Ub‐FANCD2) is indicated by an arrow. (B) AICAR treatment induces formation of FANCD2 nuclear foci in GM00637I fibroblasts. Cells grown on coverslips in 12‐well plates were treated with 0.25 mm AICAR for 24 h. Cells were immunostained with FANCD2 antibody and Alexa 488‐conjugated anti‐rabbit secondary antibody. FANCD2 foci were visualized by confocal microscopy. Representative images are shown at the top. The number of foci per cell was counted and plotted for ≥ 20 cells (bottom panel). The values represent the mean ± SEM (Student's t‐test, ***P < 0.001). (C) AICAR treatment induces FANCD2 monoubiquitination in Caki‐1 cells. Caki‐1 cells were treated with 0.25 mm AICAR for 24 h and monoubiquitination of FANCD2 was monitored as in (A). Image collected and cropped by CiteAb from the following open publication (https://pubmed.ncbi.nlm.nih.gov/28174693), licensed under a CC-BY license. Not internally tested by Novus Biologicals.
Immunocytochemistry/ Immunofluorescence: beta-Actin Antibody (AC-15) [NB600-501] -
RNA:DNA hybrid formation is central to ATM-53BP1 repair pathway.(a) Immunofluorescence using the anti-flag to quantify nuclear hybrid-binding (HB) domain foci signal in pre-permeabilized RPE cells and quantification of HB domain signal in cells treated with siATM, (b) Western blot showing ATM depletion. (c) Immunofluorescence and HB-domain foci quantification in cells treated with ATM inhibitor. (d) Quantitation of gammaH2AX foci in cells expressing HB domain or active RNAseH1, in presence or absence of H2O2 dependent oxidative stress. siC, non-targeted control siLuciferease RNA. Column bars represent the mean of n number of cells (described on each column) from three independent experiments. Error bars represent SEM. *P ≤ 0.05; **P < 0.01, ***P < 0.001 using Mann-Whitney test (a,c) and Kruskal-Wallis test followed by Dunn’s post hoc test (d). Image collected and cropped by CiteAb from the following open publication (https://pubmed.ncbi.nlm.nih.gov/30345028), licensed under a CC-BY license. Not internally tested by Novus Biologicals.

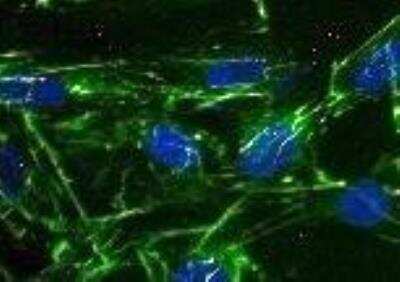

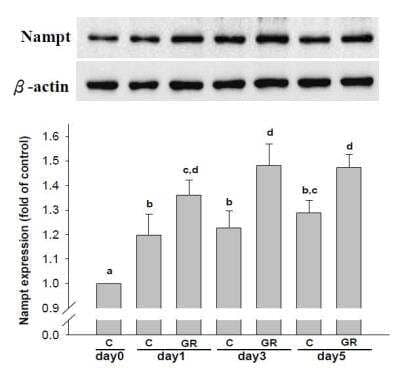
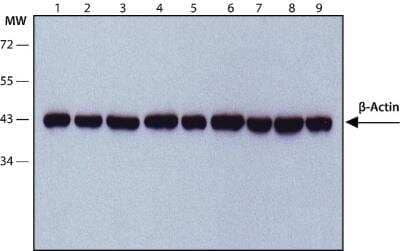
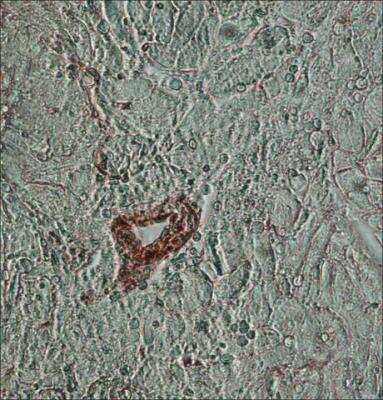
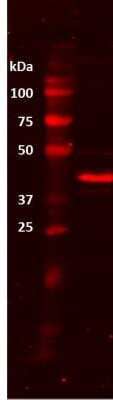
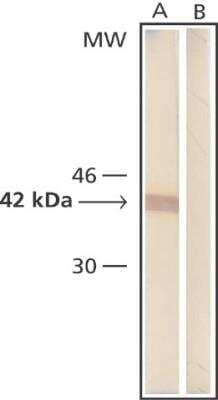
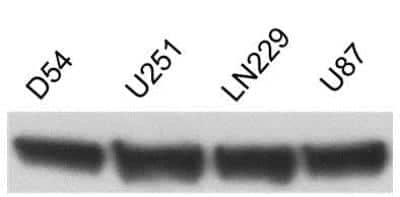
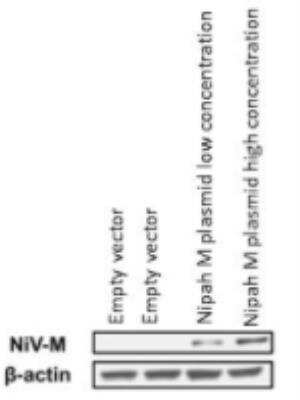
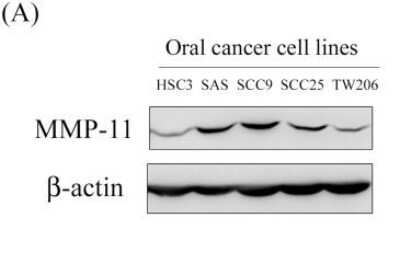
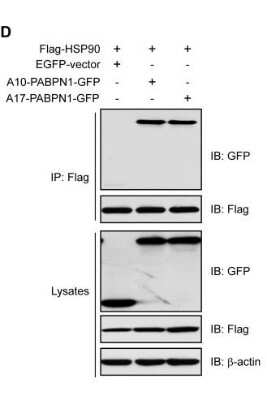
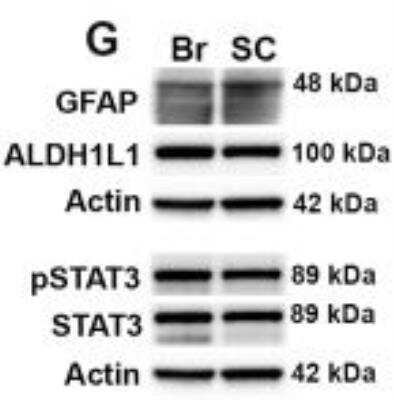
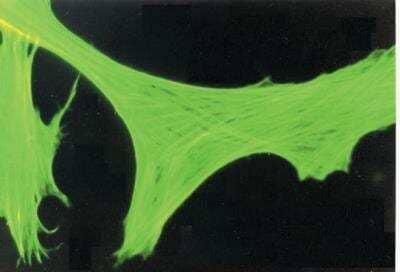
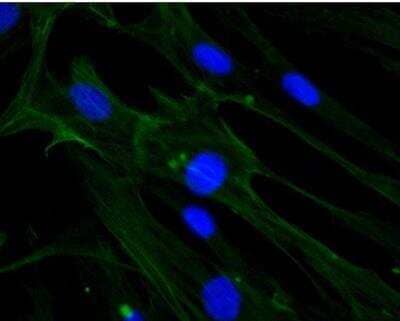
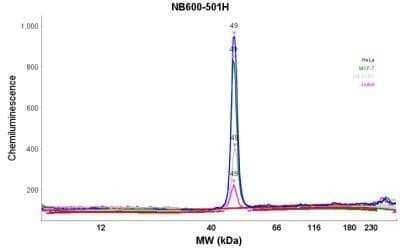
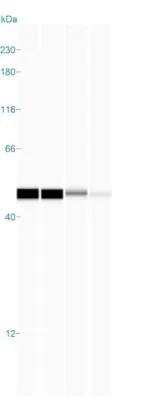
 [NB600-501] -")
 [NB600-501] -")
 [NB600-501] -")
 [NB600-501] -")
 [NB600-501] -")
 [NB600-501] -")
 [NB600-501] -")
 [NB600-501] -")
 [NB600-501] -")
 [NB600-501] -")
 [NB600-501] -")
 [NB600-501] -")
 [NB600-501] -")
 [NB600-501] -")
 [NB600-501] -")
 [NB600-501] -")
 [NB600-501] -")
 [NB600-501] -")
 [NB600-501] -")
 [NB600-501] -")
 [NB600-501] -")
 [NB600-501] -")
 [NB600-501] -")
 [NB600-501] -")
 [NB600-501] -")
 [NB600-501] -")
 [NB600-501] -")
 [NB600-501] -")
 [NB600-501] -")
 [NB600-501] -")
 [NB600-501] -")
 [NB600-501] -")
 [NB600-501] -")
 [NB600-501] -")
 [NB600-501] -")
 [NB600-501] -")
 [NB600-501] -")
 [NB600-501] -")
 [NB600-501] -")
 [NB600-501] -")
 [NB600-501] -")
 [NB600-501] -")
 [NB600-501] -")
 [NB600-501] -")
 [NB600-501] -")
 [NB600-501] -")
 [NB600-501] -")
 [NB600-501] -")
 [NB600-501] -")
 [NB600-501] -")
 [NB600-501] -")
 [NB600-501] -")
 [NB600-501] -")
 [NB600-501] -")
 [NB600-501] -")
 [NB600-501] -")
 [NB600-501] -")
 [NB600-501] -")
 [NB600-501] -")
 [NB600-501] -")
 [NB600-501] -")
 [NB600-501] -")
 [NB600-501] -")
 [NB600-501] -")
 [NB600-501] -")
 [NB600-501] -")
 [NB600-501] -")
 [NB600-501] -")
 [NB600-501] -")
 [NB600-501] -")