Mouse EGF Quantikine ELISA Kit
R&D Systems, part of Bio-Techne | Catalog # MEG00

Key Product Details
Assay Length
Sample Type & Volume Required Per Well
Sensitivity
Assay Range
Product Summary for Mouse EGF Quantikine ELISA Kit
Product Specifications
Assay Type
Format
Measurement
Detection Method
Conjugate
Reactivity
Specificity
Cross-reactivity
Interference
Precision
Intra-Assay Precision (Precision within an assay) Three samples of known concentration were tested on one plate to assess intra-assay precision.
Inter-Assay Precision (Precision between assays) Three samples of known concentration were tested in separate assays to assess inter-assay precision.
Cell Culture Supernates, Tissue Homogenates, Urine
| Intra-Assay Precision | Inter-Assay Precision | |||||
|---|---|---|---|---|---|---|
| Sample | 1 | 2 | 3 | 1 | 2 | 3 |
| n | 20 | 20 | 20 | 27 | 28 | 27 |
| Mean (pg/mL) | 35.4 | 78.0 | 244 | 28.0 | 65.3 | 232 |
| Standard Deviation | 3.2 | 7.4 | 11.8 | 2.6 | 4.6 | 18.4 |
| CV% | 9.0 | 9.5 | 4.8 | 9.3 | 7.0 | 7.9 |
EDTA Plasma, Heparin Plasma, Serum
| Intra-Assay Precision | Inter-Assay Precision | |||||
|---|---|---|---|---|---|---|
| Sample | 1 | 2 | 3 | 1 | 2 | 3 |
| n | 20 | 20 | 20 | 24 | 25 | 24 |
| Mean (pg/mL) | 34.6 | 86.6 | 304 | 34.7 | 82.8 | 299 |
| Standard Deviation | 3.4 | 7.9 | 14.7 | 3.2 | 7.7 | 28.4 |
| CV% | 9.8 | 9.1 | 4.8 | 9.2 | 9.3 | 9.5 |
Recovery for Mouse EGF Quantikine ELISA Kit
The recovery of mouse EGF spiked to three levels throughout the range of the assay in various matrices was evaluated.
| Sample Type | Average % Recovery | Range % |
|---|---|---|
| Cell Culture Supernates (n=4) | 109 | 101-119 |
| EDTA Plasma (n=4) | 97 | 87-106 |
| Heparin Plasma (n=4) | 95 | 87-105 |
| Serum (n=4) | 96 | 83-107 |
| Tissue Homogenates (n=3) | 93 | 89-101 |
Linearity
To assess the linearity of the assay, samples spiked with or containing mouse EGF in each matrix were diluted with the appropriate Calibrator Diluent to produce samples with values within the dynamic range of the assay.

Scientific Data Images for Mouse EGF Quantikine ELISA Kit
Mouse EGF ELISA Cell Culture Supernate/Tissue Homogenate/ Urine Standard Curve
Mouse EGF ELISA Serum/Plasma Standard Curve
Detection of Mouse EGF by ELISA
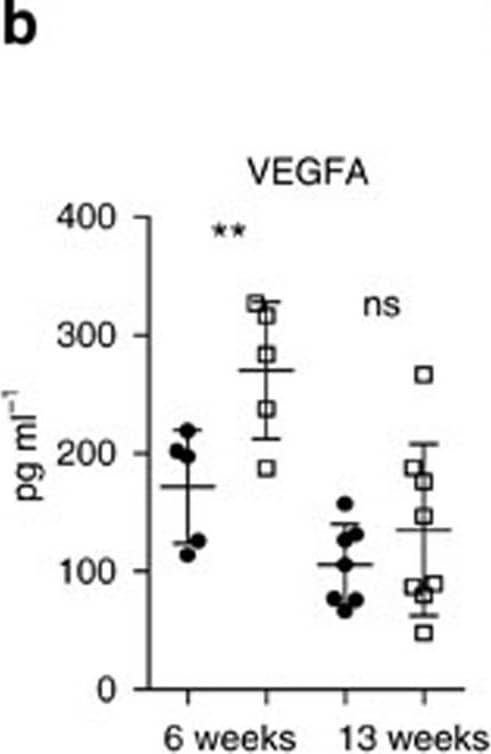
STAT3 alters tumour microenvironment and angiogenesis.(a) IHC analysis of von Willebrand Factor (vWF) and CD31 is shown in consecutive sections of murine lung tumours of the indicated genotype. On right, CD31+ counts per tumour area (mm2) quantification at indicated time points. Data were analysed by Student’s t-test and displayed as mean±s.e.m. n≥5 tumours per mouse with n≥4 mice per genotype and time point. Scale bar, 50 μm. (b) ELISA of VEGFA levels in lung tumour lysates at indicated time points. Data were analysed by Student’s t-test and displayed as mean±s.d., n≥6 mice per genotype and time point. (c) Expression levels of Pdgfa in total lungs were measured by quantitative real-time PCR at indicated time points. Values are presented as fold change of relative mRNA expression compared with Stat3 deltaLep/ deltaLep:Kras+/+ mice. Data were analysed by one-way analysis of variance (ANOVA) with Tukey’s multiple comparison test and are shown as mean± s.d., n≥5 animals/genotype. (d) Flow cytometric analysis of Cd11b+Gr1+ granulocytes and Cd11b+ F4/80+ macrophages in bronchoalveolar lavage (BAL) at 6 and 13 weeks post AdCre. Data were analysed by one-way ANOVA with Tukey’s multiple comparison test and are shown as mean±s.e.m. (e) Flow cytometric analysis of myeloid-derived suppressor cell (MDSC) subsets at 6 and 13 weeks post AdCre. Data were analysed by one-way ANOVA with Tukey’s multiple comparison test and are shown as mean± s.e.m. (f) Ratio of CD4+/CD8+ T-cell counts in BAL are shown. Data were analysed by Kruskal–Wallis test with Dunn’s multiple comparison testing and are shown as mean±s.e.m. Data displayed in d–f are n≥6 mice per genotype and time point, 13-week group represents two independent experiments. (g) Flow cytometric analysis of Cd11b+Gr1+ and Cd11b+ F4/80+ cells of A549 shControl versus A549-shSTAT3 xenograft tumours. Data were analysed by Student’s t-test and are displayed as mean±s.e.m. (n≥8 tumours; ≥4 mice per group). (h) IHC analysis and representative pictures of CD31+ counts per xenograft tumour area (mm2). Scale bar, 100 μm (n=8 tumours/≥4 mice). Data were analysed by Student’s t-test and are shown as mean±s.e.m. For all graphs: *P<0.05; **P<0.01; ***P<0.001. Image collected and cropped by CiteAb from the following publication (https://www.nature.com/articles/ncomms7285), licensed under a CC-BY license. Not internally tested by R&D Systems.Preparation and Storage
Shipping
Stability & Storage
Background: EGF
Long Name
Alternate Names
Gene Symbol
Additional EGF Products
Product Documents for Mouse EGF Quantikine ELISA Kit
Product Specific Notices for Mouse EGF Quantikine ELISA Kit
For research use only
⚠ WARNING: This product can expose you to chemicals including N,N-Dimethylforamide, which is known to the State of California to cause cancer. For more information, go to www.P65Warnings.ca.gov.


